This chart shows the ranking of players with the most goals in Europe's top 5 football leagues (Premier League, La Liga, Bundesliga, Serie A, Ligue 1) from the 2013/14 season to the 2022/23 season. This period serves as an important indicator of each player's scoring ability and consistency, with a high number of goals signifying superior offensive performance across Europe's elite football leagues. The chart provides insight into the top scorers in European football and their goal-scoring trends over this time.
This chart displays the best-selling games on the Nintendo Switch platform as of 2023. This data highlights the popularity and market success of the Nintendo Switch, showcasing how diverse genres and the creative efforts of developers have captivated audiences and generated sales. These top-selling games have garnered high acclaim among Nintendo Switch users, known for leveraging the platform's unique features to the fullest.
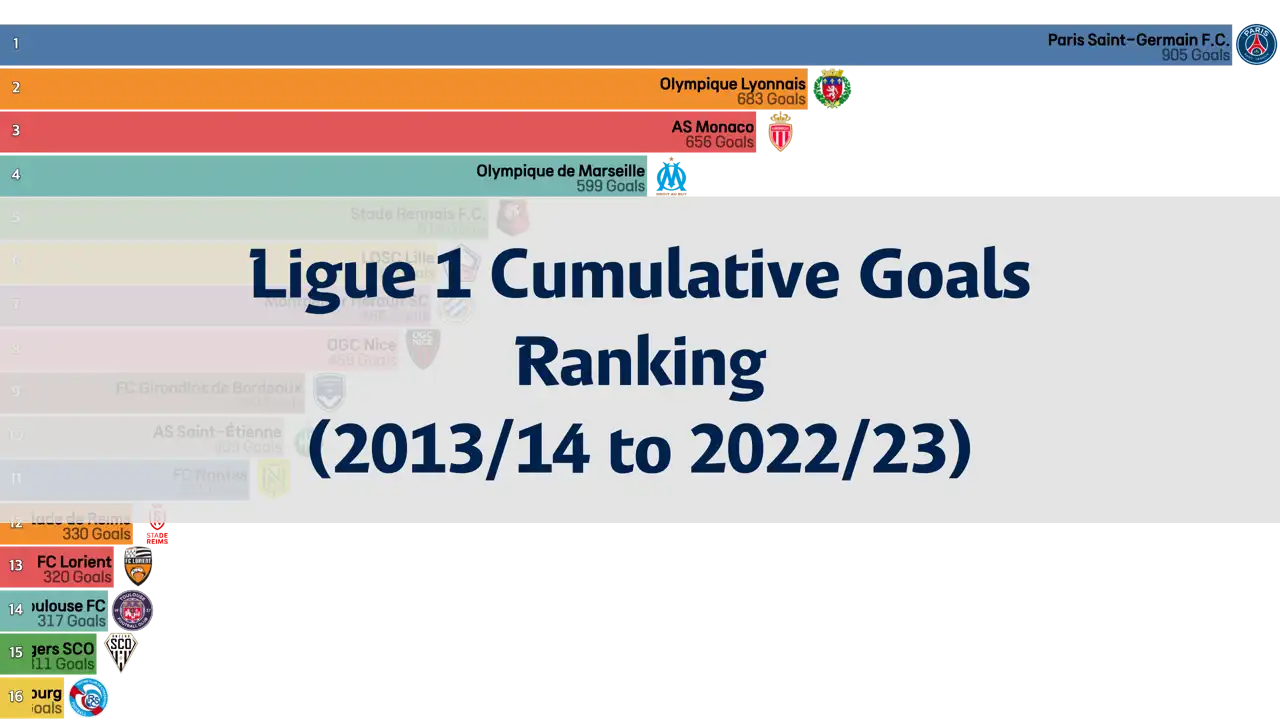
This chart shows the ranking of players with the most goals in France's Ligue 1 from the 2013/14 season to the 2022/23 season. This period serves as an important indicator of each player's scoring ability and consistency, with a high number of goals signifying superior offensive performance in France's top football league. The chart provides insight into the top scorers in Ligue 1 history and their goal-scoring trends over time.
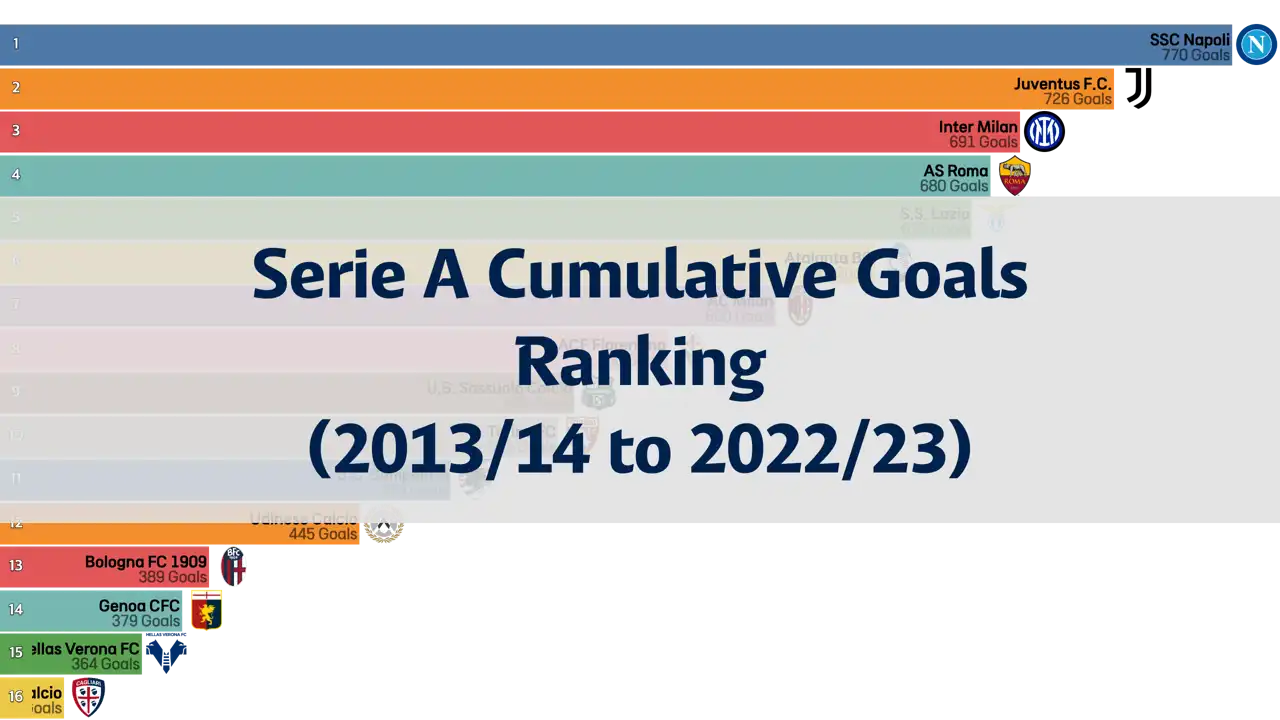
This chart displays the ranking of players with the most goals in Serie A from the 2013/14 season to the 2022/23 season. This period serves as an important indicator of each player's scoring ability and consistency, with a high number of goals signifying superior offensive performance in Italy's top football league. The chart provides insight into the top scorers in Serie A history and their goal-scoring trends over this time.
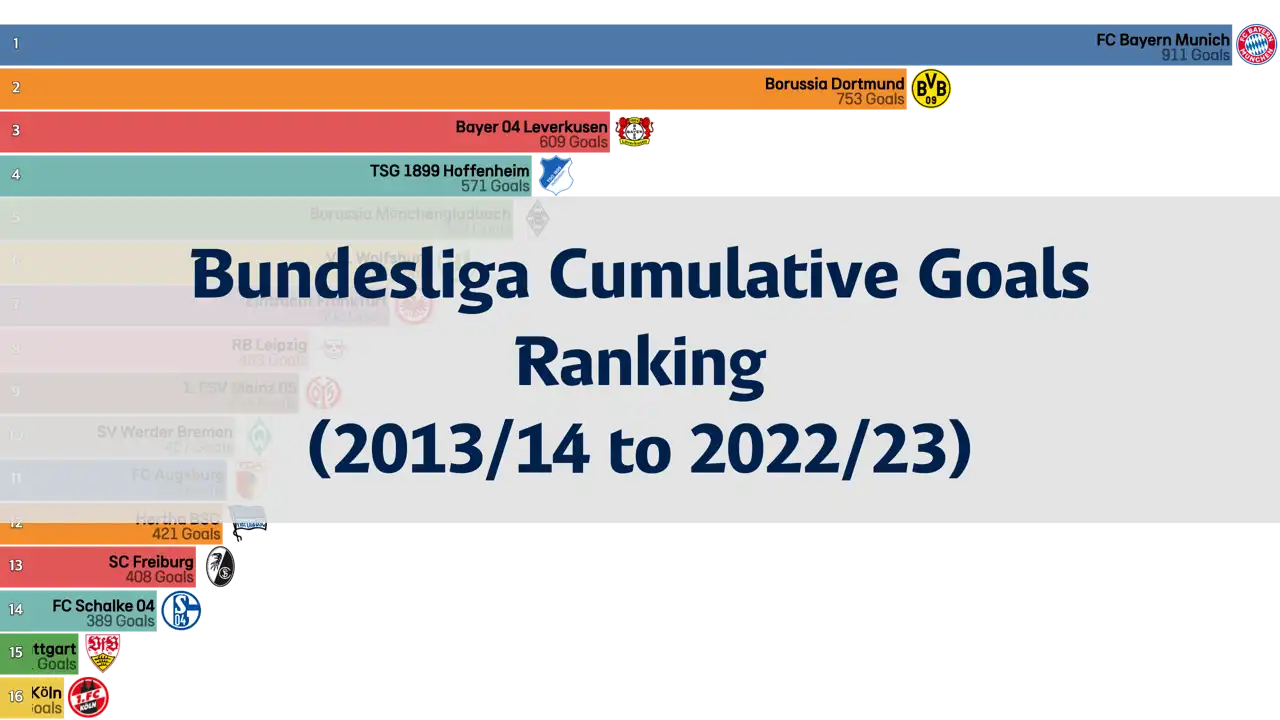
This chart presents the ranking of players with the most goals in the Bundesliga from the 2013/14 season to the 2022/23 season. It serves as a crucial indicator of each player's scoring ability and consistency over this period, with a high number of goals indicating outstanding offensive performance in one of the world's most competitive football leagues. The chart allows us to observe the top scorers in Bundesliga history and their goal-scoring trends over time.
This chart shows the cumulative number of gold medals won by countries in the Summer Olympics from 1896 to 2020. This period serves as an important indicator of each country's sports performance and excellence in the Summer Olympics, reflecting the level of sports development and position in international sports competition. Through this chart, we can observe the trends of countries that have historically been sports powerhouses and those that have seen significant changes in their gold medal counts over time.
This chart compares the number of goals scored by Lionel Messi, Cristiano Ronaldo, Harry Kane, Kylian Mbappé, and Erling Haaland throughout 2023. It allows us to see which player demonstrated the most outstanding goal-scoring ability in 2023, serving as a crucial indicator of each player's performance and attacking prowess. The total goals for each player include those scored for both their club and national teams.
This chart displays the movies that were the most watched on Netflix within the first three months of their release. Analyzing viewership data during this period allows us to identify which films captured the attention of audiences worldwide. This data reflects Netflix's viewership ratings and audience preferences, highlighting the films that garnered especially high interest across various genres and styles.
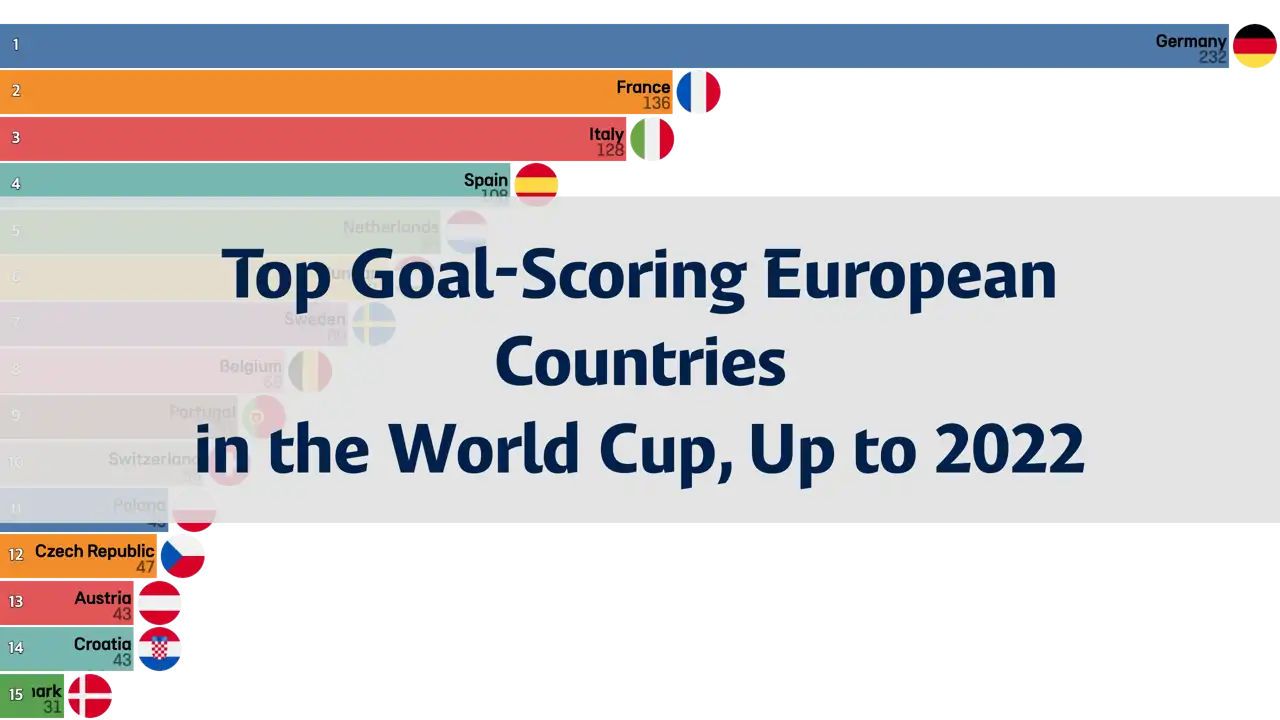
This chart displays the European countries that have scored the most goals in FIFA World Cup tournaments up to the 2022 World Cup. It ranks the countries affiliated with the Union of European Football Associations (UEFA) based on their cumulative goal count throughout the history of the competition. This serves as an important indicator of the competitiveness and level of football development among European nations on the international stage.
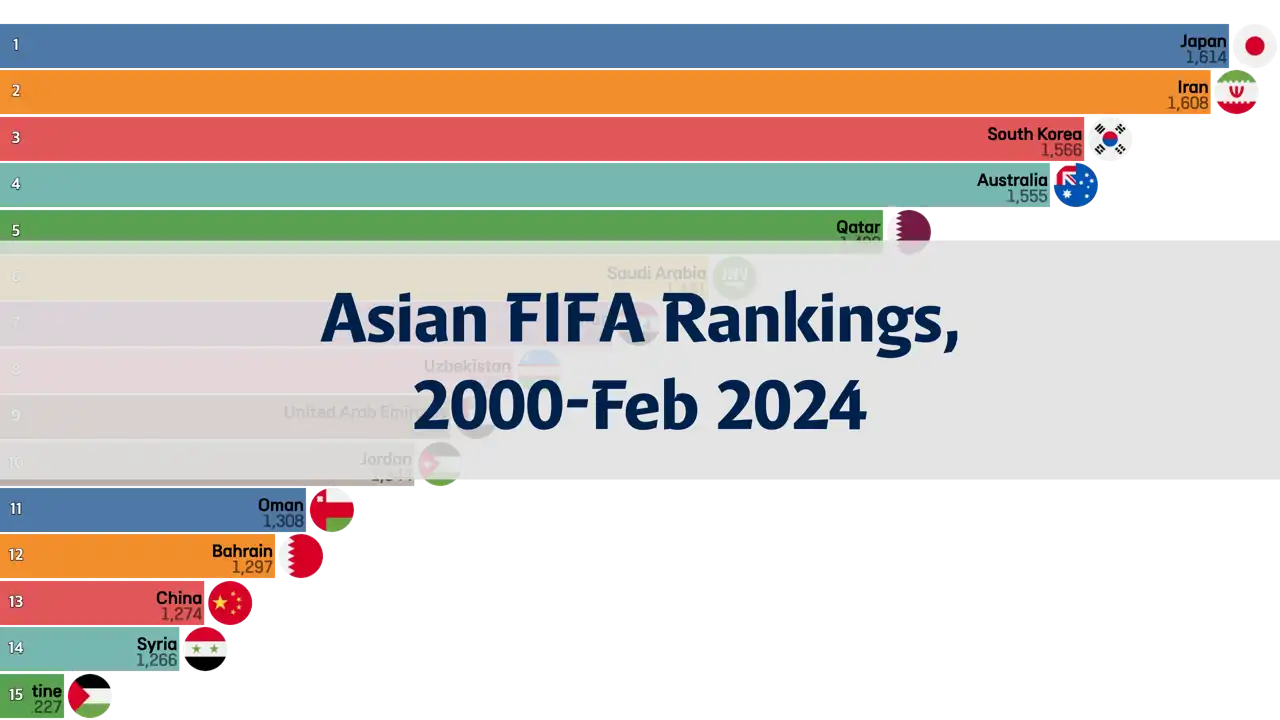
This chart displays the FIFA ranking changes of Asian countries from 2000 to February 2024. Over this period, the rankings reflect the performance of the national football teams belonging to the Asian Football Confederation (AFC) on the international stage, providing a key indicator of the competitiveness and development level of football in Asia. FIFA rankings are determined based on the outcomes of international matches, ranking national teams according to their performance in competitions and friendly matches.
This chart shows the Asian countries that have scored the most goals in FIFA World Cup tournaments up to the 2022 Qatar World Cup. It ranks the countries within the Asian Football Confederation (AFC) based on their cumulative goal count throughout the history of the competition. This serves as an important indicator of the competitiveness and level of football development among Asian nations on the international stage.
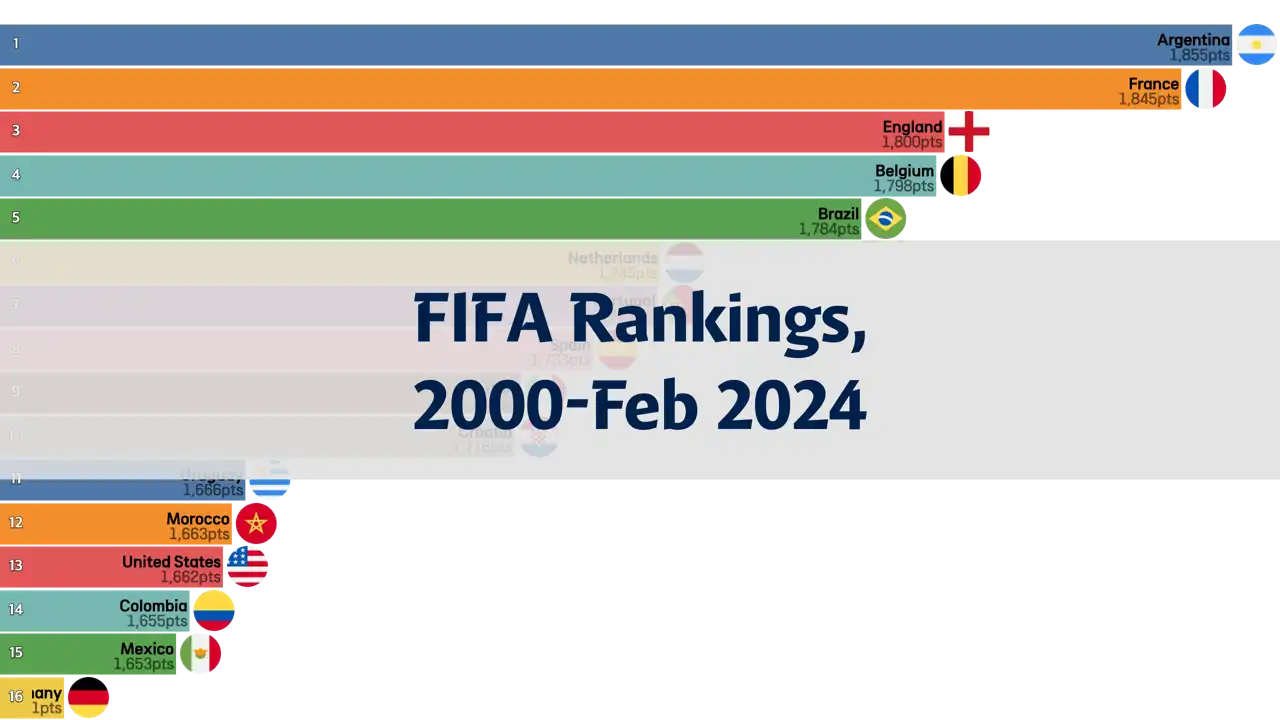
This chart illustrates the changes in the FIFA rankings from the year 2000 to February 2024. Throughout this period, the ranking fluctuations based on the performance of national football teams offer insights into the competitiveness and trends within world football. The FIFA rankings are determined based on the outcomes of international matches, reflecting the performance of national teams in competitions and friendly matches.
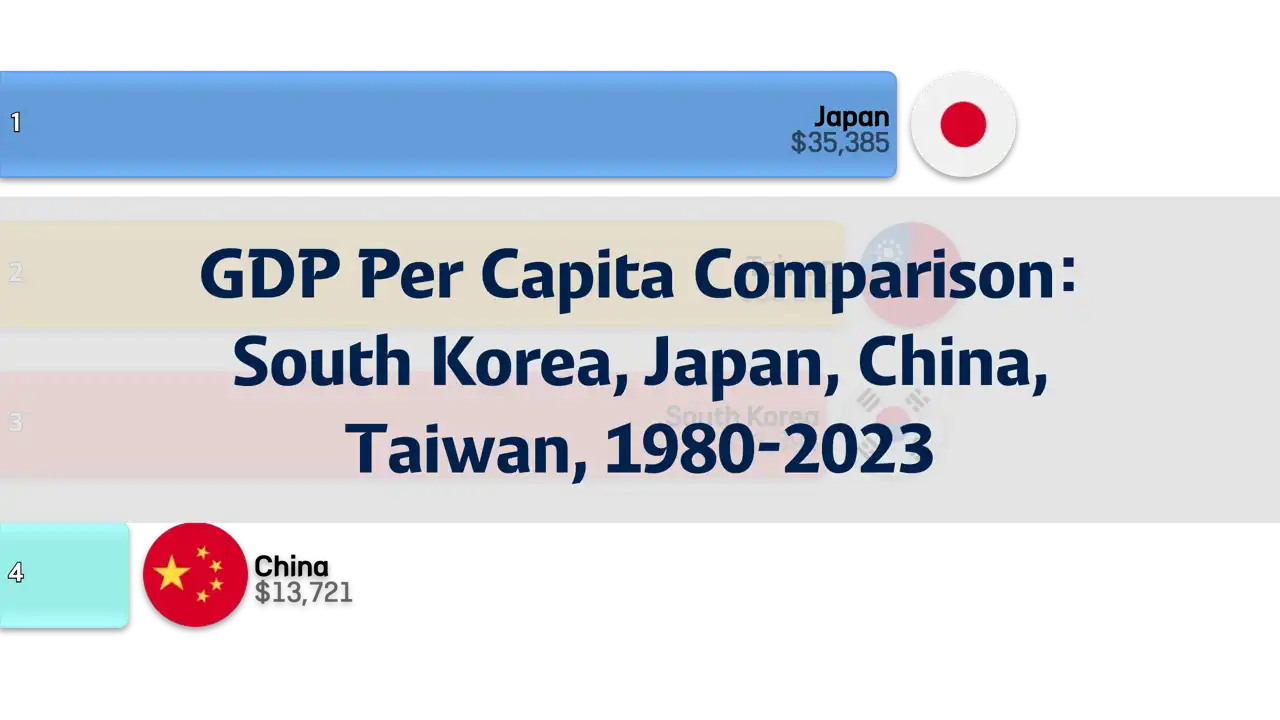
This chart compares the GDP per capita of South Korea, Japan, China, and Taiwan from 1980 to 2023. It reveals the economic growth patterns and changes in GDP per capita among these nations, allowing an examination of economic development and shifts in income levels over time. The period showcases the rapid economic growth of some countries and the relatively stable growth of others.
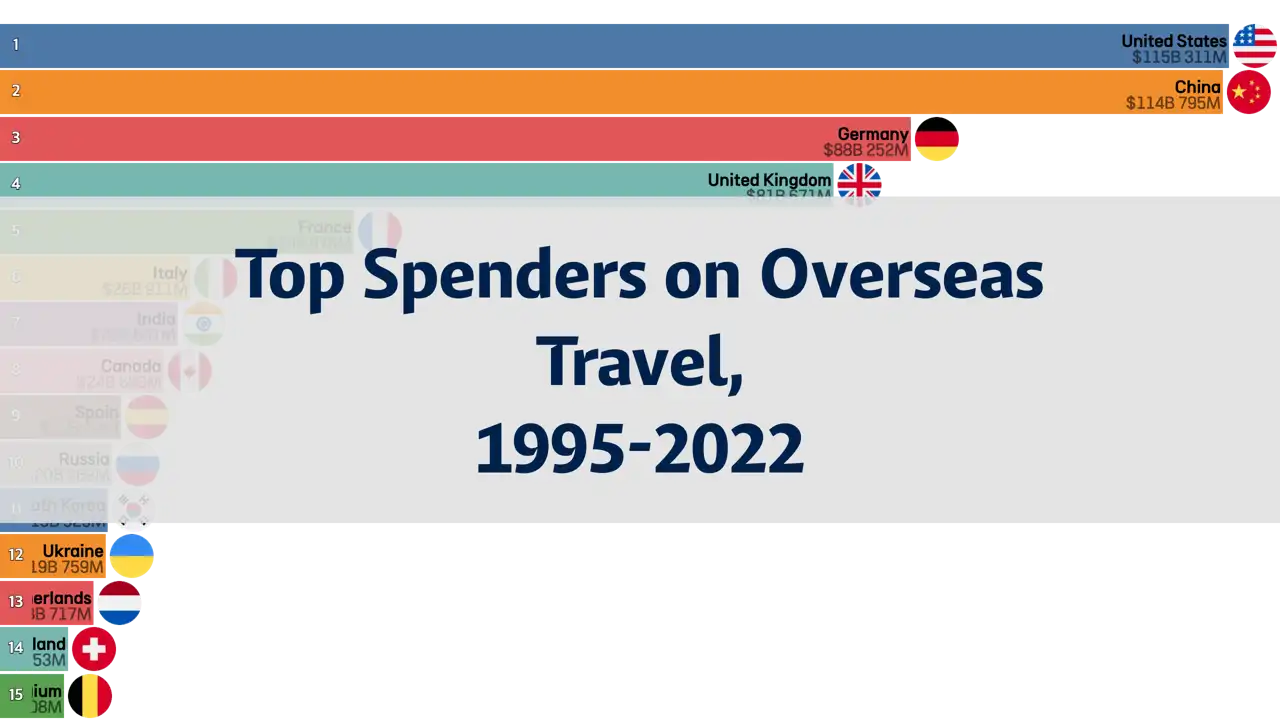
This chart presents the countries that have spent the most on overseas travel from 1995 to 2022. It highlights the significant shifts and trends in travel economics among key nations over this period. The expenditure on travel reflects the economic conditions, purchasing power of the populace, and shifts in global tourism trends of each country.
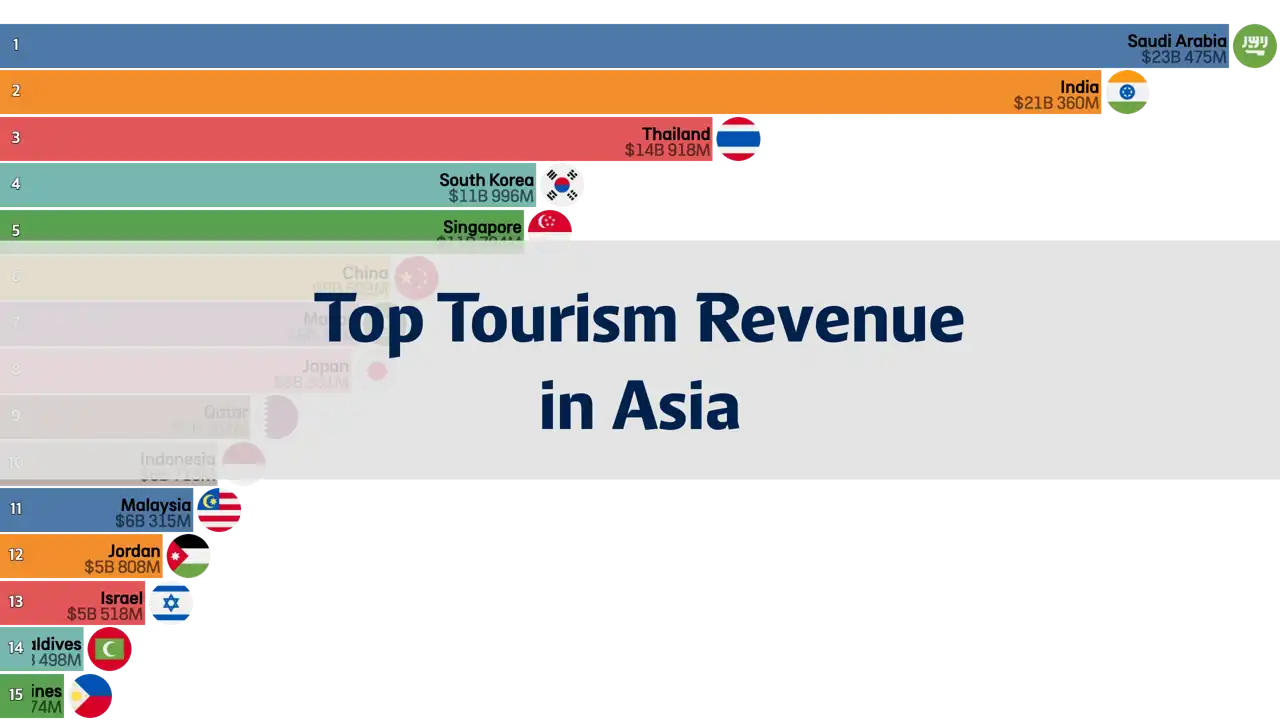
This chart illustrates the changes in which Asian country had the highest tourism revenue from 1995 to 2022. Ranking is based on the tourism income, a key indicator of the growth of the tourism industry and its impact on the economy for each year. It reflects the efforts made by various Asian countries to develop their tourism sectors over this period and showcases the contribution of tourism revenue to national economies.
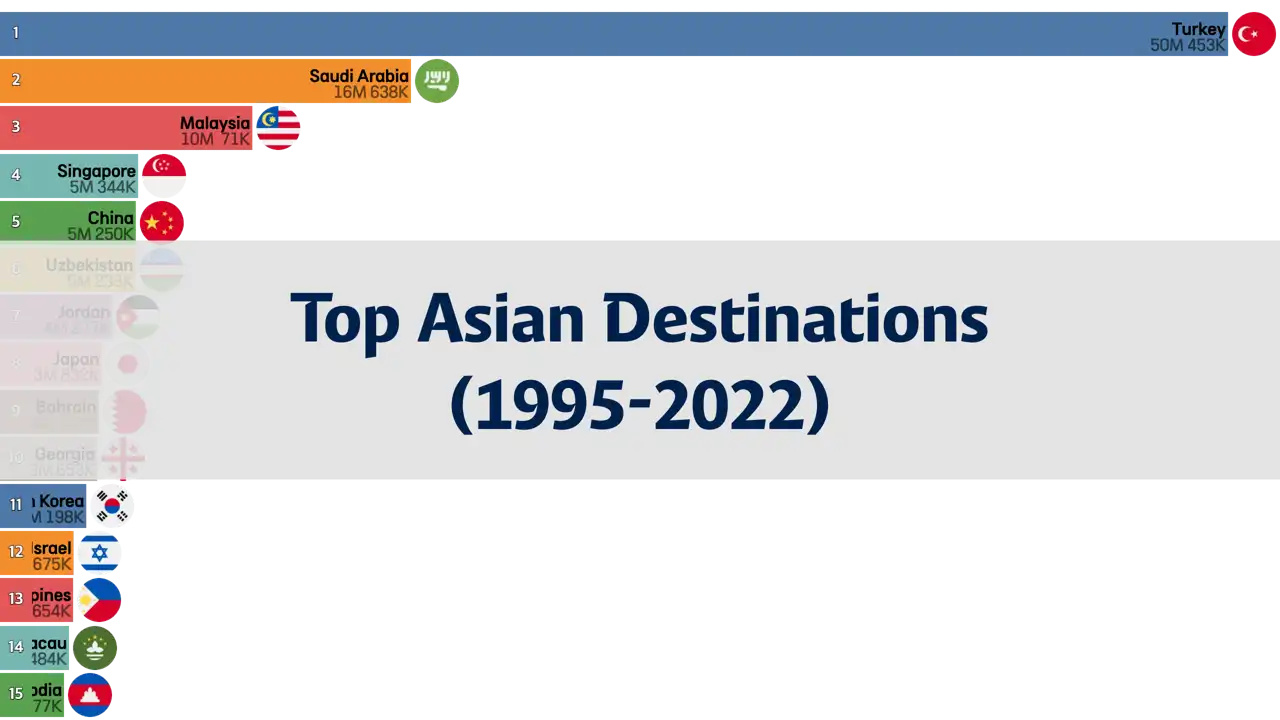
This chart displays the Asian countries most visited by tourists from 1995 to 2022, highlighting Asia's rise as a key destination in the global tourism market. Countries such as Thailand, Japan, China, Malaysia, and Singapore frequently top the list, captivating global travelers with their diverse cultures, historical landmarks, and beautiful natural landscapes.