A review of average annual salaries by company location in South Korea reveals significant regional disparities. Dong-gu, Incheon, leads the nation with an average annual salary of ₩70.6M, followed closely by industrial hubs like Bug-gu, Ulsan. The data highlights a strong concentration of high-paying jobs in the Seoul Metropolitan Area and key industrial cities, underscoring the economic divide between different parts of the country.
The 'Average Annual Salary' in this context refers to the mean annual income of employees, calculated based on the registered address of the company they work for, not their personal residence. This metric provides insight into the economic value and type of industries concentrated in a specific geographic area.
The Economic Geography of High Salaries in South Korea
The distribution of average annual salaries across South Korea reveals a landscape shaped by industrial might and metropolitan concentration. The highest earnings are not randomly scattered but are clustered in specific areas that serve as the nation's economic engines. These regions are typically home to global corporate headquarters, major industrial complexes, and significant logistical hubs, creating a high concentration of well-compensated jobs.
Industrial Powerhouses and Corporate Headquarters
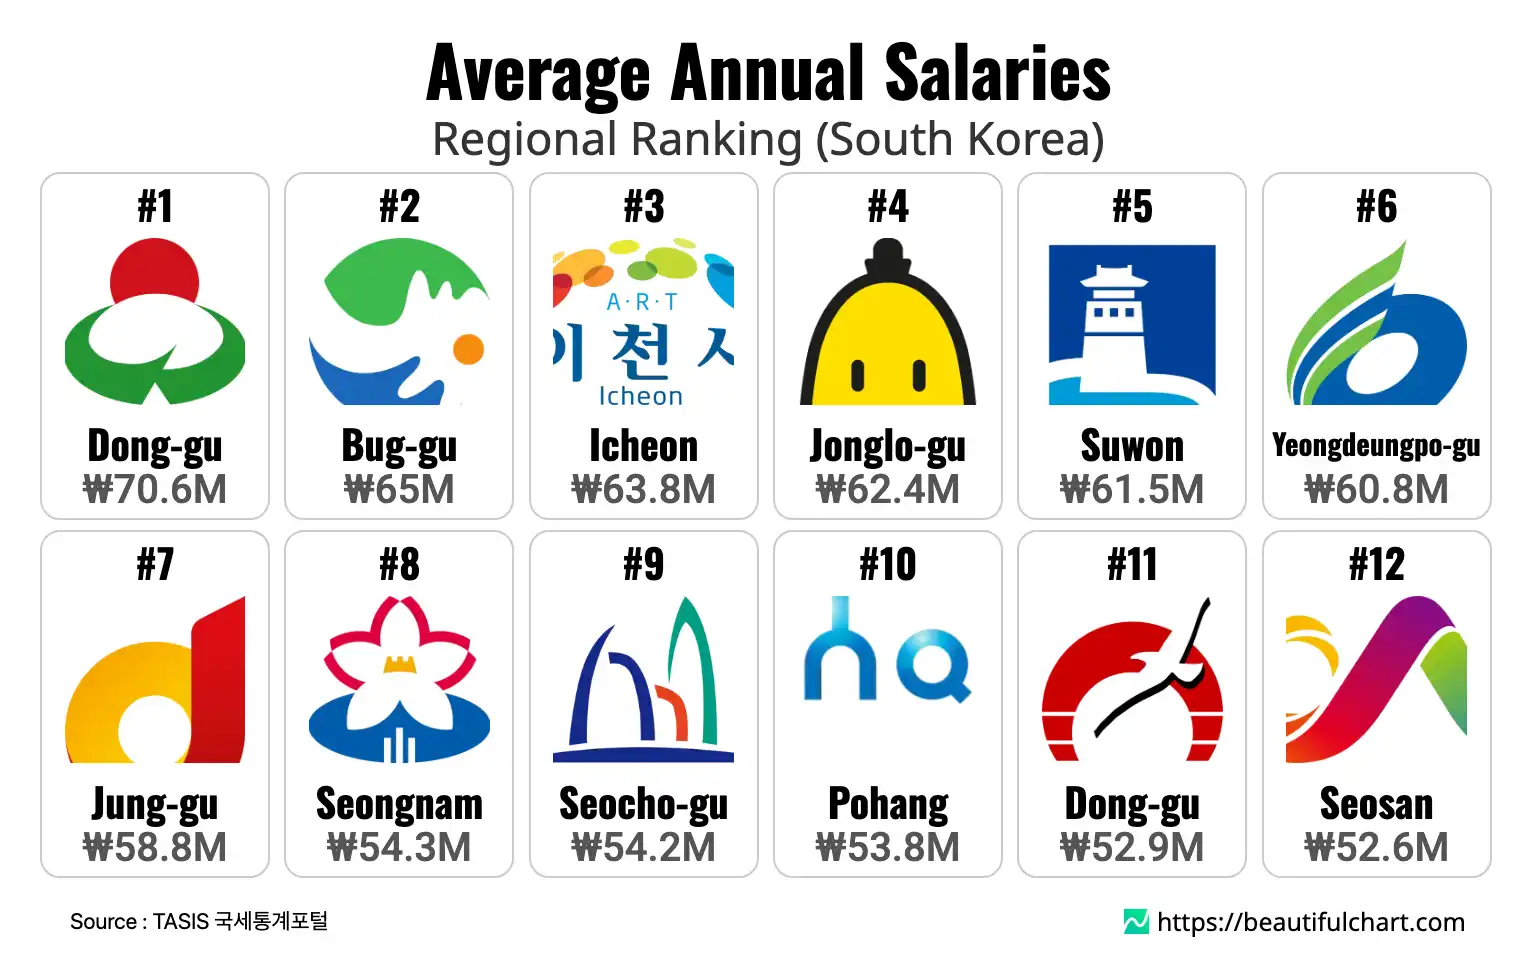
Topping the list are areas synonymous with South Korea's key industries. Dong-gu, Incheon (₩70.6M), and Bug-gu, Ulsan (₩65M), are prime examples. Ulsan, in particular, is the heart of the nation's automotive and shipbuilding industries, hosting the headquarters and primary factories for giants like Hyundai. Similarly, Icheon in Gyeonggi Province (₩63.8M) is home to SK Hynix, a world leader in semiconductor manufacturing. The presence of such large-scale, high-value industries directly translates into higher average wages for the local workforce. This phenomenon is not unlike what is seen in the United States, where cities like Detroit historically had high wages due to the auto industry, or how tech hubs like San Jose (Silicon Valley) command the highest salaries today due to the concentration of major technology firms.
The Dominance of the Seoul Metropolitan Area
The data also underscores the economic primacy of the Seoul Metropolitan Area, which includes Seoul, Incheon, and Gyeonggi Province. A significant number of the top-earning districts are located here. Jongno-gu (₩62.4M), Yeongdeungpo-gu (₩60.8M), and Jung-gu (₩58.8M) in Seoul are traditional central business districts housing the headquarters of major financial institutions, conglomerates (chaebols), and various corporate offices. Suwon (₩61.5M), home to Samsung Electronics, further illustrates how Gyeonggi Province benefits from hosting world-leading technology companies. This concentration of corporate power in and around the capital creates a powerful magnetic effect, drawing talent and investment, which in turn drives up average salaries compared to more rural or less industrialized regions.
Regional Disparities and Economic Implications
The information paints a clear picture of economic disparity. While some regions boast average salaries exceeding ₩60M or even ₩70M, many others, particularly in rural provinces, fall significantly behind. This gap reflects the uneven nature of South Korea's rapid economic development, which has been heavily reliant on a few key industries and centered around the capital. This situation presents both challenges and opportunities. For the government and businesses, it highlights the need for policies that encourage decentralized growth and investment in other regions to foster a more balanced national economy. For individuals, it maps out the financial incentives tied to working in specific industrial or corporate centers.
South Korea's Highest-Paying Regions
A review of average annual salaries by company location in South Korea reveals significant regional disparities.
Key Takeaways
Concentration in Industrial Hubs
- The highest average salaries are found in regions with a strong industrial base, such as automotive, shipbuilding, and semiconductor manufacturing.
- Ulsan and Icheon stand out as key examples where major industrial players significantly lift the average local income.
- These industrial centers attract a highly skilled workforce, further driving up wage levels.
The Seoul Metropolitan Area's Economic Dominance
- A large number of high-paying regions are concentrated in Seoul and the surrounding Gyeonggi Province.
- Central business districts in Seoul, like Jongno-gu and Yeongdeungpo-gu, host the headquarters of major corporations and financial firms.
- The presence of global tech giants like Samsung and SK Hynix in Gyeonggi Province solidifies the area's status as the nation's primary economic core.
Top Ranking
#1 Dong-gu, Incheon: ₩70.6M
Dong-gu in Incheon records the highest average annual salary in the nation. This is largely attributed to its role as a major industrial and logistics hub. The area is home to numerous large-scale industrial complexes, including facilities for steel manufacturing and heavy industry. Its proximity to Incheon Port, one of South Korea's largest and busiest ports, means it also hosts many high-value logistics and trade-related companies. The combination of capital-intensive industries and the critical functions of international trade creates a demand for a well-compensated workforce, placing it at the top of the list.
#2 Bug-gu, Ulsan: ₩65M
Bug-gu is a district in the city of Ulsan, which is widely known as the industrial capital of South Korea. The region's high average salary is overwhelmingly driven by the presence of the world's largest automobile assembly plant, operated by Hyundai Motor Company. Beyond automotive manufacturing, the area also features a significant concentration of related suppliers and heavy industries. The dominance of these major, highly unionized industrial employers results in high wage standards that elevate the average income for the entire district, making it a powerhouse of the nation's manufacturing sector.
#3 Icheon, Gyeonggi: ₩63.8M
Icheon, a city in Gyeonggi Province, owes its high salary ranking to the semiconductor industry. It is the headquarters and a major production base for SK Hynix, one of the world's largest memory chip manufacturers. The semiconductor industry is known for its high-tech, high-value-added nature, requiring a specialized and highly skilled workforce that commands significant compensation. The presence of this single, dominant global tech company and its ecosystem of suppliers and partners is powerful enough to make Icheon one of the wealthiest cities in the country in terms of average wages.
#4 Jongno-gu, Seoul: ₩62.4M
Jongno-gu is one of Seoul's most central and historic districts, but its high salary ranking is due to its modern role as a premier business hub. The district is home to the headquarters of many of South Korea's largest conglomerates (chaebols), major banks, financial institutions, and consulting firms. Its location in the heart of the capital makes it a prime spot for corporate headquarters, leading to a high concentration of executive, managerial, and professional service jobs. This density of high-level corporate employment naturally results in a high average salary for the area.
#5 Suwon, Gyeonggi: ₩61.5M
Suwon is another key city in Gyeonggi Province whose economic fortunes are inextricably linked to a single corporate giant: Samsung Electronics. The city is home to Samsung Digital City, the global headquarters and a massive research and development center for the tech behemoth. The campus employs tens of thousands of highly paid researchers, engineers, and corporate staff. The immense scale of Samsung's operations, combined with its position as a global leader in technology and innovation, creates a powerful local economy and drives the average salary to be among the highest in the nation.
| Rank | Name | Indicator | Subindicator |
|---|---|---|---|
1 | ₩ 70M 581K | Total Salary - ₩ 2.6T | |
2 | ₩ 64M 956K | Total Salary - ₩ 6.1T | |
3 | ₩ 63M 790K | Total Salary - ₩ 7.1T | |
4 | ₩ 62M 407K | Total Salary - ₩ 24.9T | |
5 | ₩ 61M 504K | Total Salary - ₩ 31.1T | |
6 | ₩ 60M 812K | Total Salary - ₩ 35.6T | |
7 | ₩ 58M 833K | Total Salary - ₩ 32.7T | |
8 | ₩ 54M 330K | Total Salary - ₩ 27.7T | |
9 | ₩ 54M 198K | Total Salary - ₩ 27.7T | |
10 | ₩ 53M 842K | Total Salary - ₩ 9.1T | |
11 | ₩ 52M 865K | Total Salary - ₩ 3.3T | |
12 | ₩ 52M 568K | Total Salary - ₩ 3.1T | |
13 | ₩ 52M 290K | Total Salary - ₩ 51.5T | |
14 | ₩ 50M 976K | Total Salary - ₩ 4.6T | |
15 | ₩ 50M 544K | Total Salary - ₩ 23.1T | |
16 | ₩ 50M 421K | Total Salary - ₩ 3.4T | |
17 | ₩ 49M 302K | Total Salary - ₩ 18.2T | |
18 | ₩ 48M 626K | Total Salary - ₩ 2.4T | |
19 | ₩ 47M 893K | Total Salary - ₩ 4.2T | |
20 | ₩ 47M 886K | Total Salary - ₩ 14.5T |


