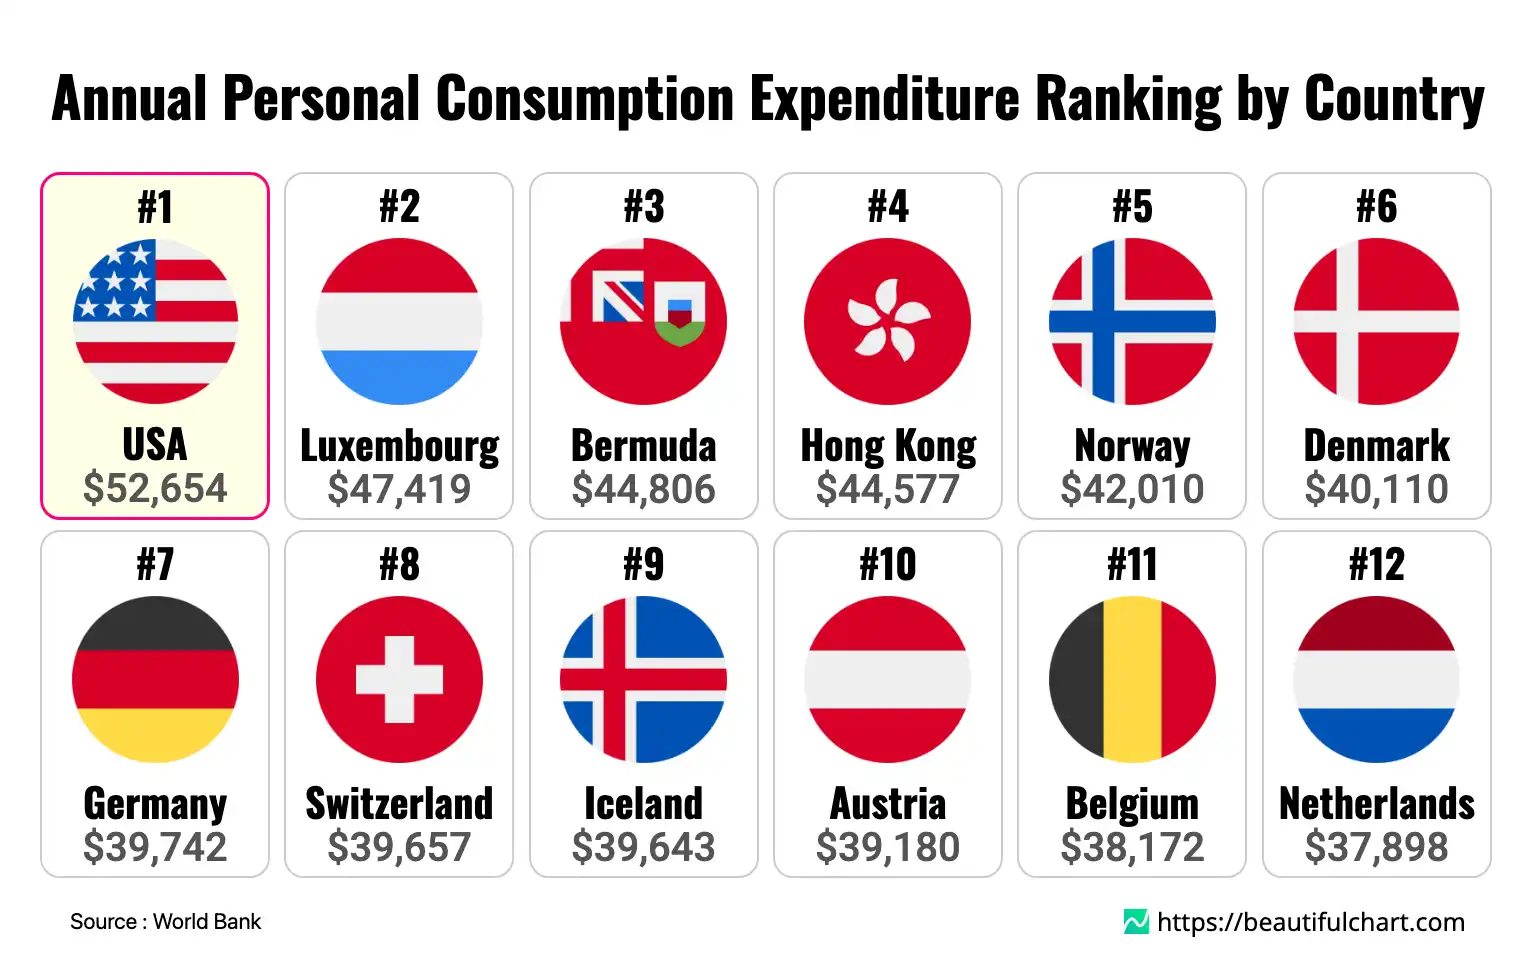
The United States leads the world in personal consumption, with individuals spending an average of $52,654 annually, adjusted for purchasing power. Following the U.S. are Luxembourg and Bermuda, highlighting a trend where advanced economies and international financial hubs dominate the top of the list. This ranking showcases the significant purchasing power concentrated in North America, Western Europe, and parts of Asia, reflecting high disposable incomes and robust consumer markets in these regions.
Personal Consumption Expenditure (PPP) measures the total spending by individuals on goods and services within a country. By adjusting this figure for Purchasing Power Parity (PPP), it accounts for differences in the cost of living, providing a more accurate comparison of consumer spending power and economic well-being across different nations.
Understanding Global Consumer Power
High levels of personal consumption expenditure are a hallmark of advanced economies, signaling robust economic activity, high disposable incomes, and strong consumer confidence. The figures, adjusted for purchasing power parity (PPP), provide a standardized measure of how much goods and services individuals in different nations can acquire. At the forefront is the United States, where a deeply ingrained consumer culture, widespread access to credit, and a vast retail market contribute to the world's highest personal spending per capita. This consumer-driven model fuels a significant portion of its GDP, making household spending a critical barometer of the nation's economic health.
The Dominance of Developed Nations and Financial Hubs
The list of top spenders is heavily populated by developed nations in North America and Western Europe, alongside key Asian financial centers. Countries like Luxembourg, Norway, Denmark, and Switzerland demonstrate how high wages, strong social welfare systems, and stable economic environments translate into substantial purchasing power for their citizens. Their high rankings reflect not just wealth but also an economic structure that supports a high quality of life. Furthermore, the presence of smaller territories like Bermuda, Hong Kong, and the Cayman Islands near the top is notable. These jurisdictions often function as global financial hubs, attracting high-net-worth individuals and fostering economies with exceptionally high average incomes, which in turn drives up personal consumption levels.
The Significance of Purchasing Power Parity (PPP)
Comparing personal consumption using a PPP adjustment is crucial for an accurate global comparison. Nominal figures can be misleading because they don't account for the vast differences in the cost of living from one country to another. For example, the same amount of money can buy significantly more in a country with lower price levels. PPP adjusts for these differences, effectively measuring the volume of goods and services a person can purchase. This method provides a more realistic insight into the actual economic well-being and living standards of residents, moving beyond simple currency conversions to reflect true purchasing power.
Global Disparities and Economic Implications
The distribution of personal spending across the globe reveals stark economic disparities. While the top-ranking countries show per capita spending in the tens of thousands of dollars, many nations in the lower half of the list have figures that are a fraction of that amount. This highlights the vast gap in economic development, income levels, and access to goods and services between the world's wealthiest and poorest regions. High consumption can be a powerful engine for economic growth, but it also raises important questions about sustainability, household debt, and resource allocation on a global scale. The patterns in personal spending offer valuable insights for policymakers, businesses, and economists analyzing global economic trends and development challenges.
Global Ranking
The United States leads the world in personal consumption, with individuals spending an average of $52,654 annually, adjusted for purchasing power.
Key Takeaways
Dominance of Advanced Economies
- The United States leads significantly with over $52,000 in per capita spending, showcasing its powerful consumer-driven economy.
- European nations, including Luxembourg, Norway, and Denmark, feature heavily in the top rankings, indicating high standards of living and economic stability.
- Financial hubs like Bermuda and Hong Kong also demonstrate exceptionally high personal spending levels due to concentrated wealth and high average incomes.
The Importance of PPP Adjustment
- Using Purchasing Power Parity provides a truer measure of what citizens can actually buy with their money compared to nominal figures.
- This metric levels the playing field by removing distortions caused by varying price levels across different countries.
- It reveals the actual purchasing power and economic well-being of residents more accurately, offering a deeper insight into living standards.
Top Ranking
1. USA ($52,654)
The United States holds the top position with the highest personal consumption expenditure per capita. This is driven by its large, diverse, and consumer-oriented economy. High average disposable incomes, widespread access to credit, and a deeply ingrained consumer culture encourage spending across a vast range of goods and services. The nation's robust retail sector, both online and offline, further facilitates this high level of consumption, which is a primary driver of its overall economic activity and GDP.
2. Luxembourg ($47,419)
As a major global financial center and one of the wealthiest countries in the world, Luxembourg's high ranking is fueled by exceptionally high wages and a large population of affluent international professionals. The country's strong economy, political stability, and high standard of living contribute to significant disposable income for its residents. This wealth translates directly into high levels of personal spending on both essential and luxury goods, securing its place near the top of the global ranking.
3. Bermuda ($44,806)
Bermuda's position as a leading offshore financial and insurance hub results in a high concentration of wealth and some of the world's highest average incomes. Despite its small size, the territory's specialized economy provides high-paying employment opportunities, which in turn fuels substantial consumer spending. The high cost of living on the island is matched by the impressive purchasing power of its residents, placing it third in the global ranking for personal consumption.
4. Hong Kong ($44,577)
Hong Kong's status as a premier international financial hub and a gateway to mainland China contributes to its high level of personal consumption. The city boasts a high concentration of wealth, low tax rates, and a vibrant, trade-driven economy. This environment fosters significant disposable income, leading to strong consumer spending, particularly in areas like luxury goods, dining, and technology. Its dynamic retail scene and affluent population solidify its position as a top global spender.
5. Norway ($42,010)
Norway's high personal consumption is underpinned by its immense wealth derived from natural resources, particularly oil and gas, which is managed through the world's largest sovereign wealth fund. This resource wealth supports a comprehensive social welfare system, high wages, and low unemployment. As a result, Norwegians enjoy a very high standard of living and significant purchasing power, allowing for substantial spending on goods, services, and leisure activities.
| Rank | Name | Indicator |
|---|---|---|
1 | $ 52,654 | |
2 | $ 47,419 | |
3 | $ 44,806 | |
4 | $ 44,577 | |
5 | $ 42,010 | |
6 | $ 40,110 | |
7 | $ 39,742 | |
8 | $ 39,657 | |
9 | $ 39,643 | |
10 | $ 39,180 | |
11 | $ 38,172 | |
12 | $ 37,898 | |
13 | $ 37,818 | |
14 | $ 37,240 | |
15 | $ 37,067 | |
16 | $ 37,062 | |
17 | $ 37,030 | |
18 | $ 36,439 | |
19 | $ 36,403 | |
20 | $ 35,066 |


