The global automotive landscape reveals a significant shift in passenger car manufacturing. Major industrial nations have accumulated vast production totals over decades, shaping the worldwide supply chain and economic dynamics. This analysis highlights the leading countries that have dominated cumulative passenger car output, reflecting their enduring influence and industrial capacity in the automotive sector.
Cumulative Passenger Car Production refers to the total number of passenger cars manufactured by a country over a specified period. This metric provides a long-term view of a nation's industrial capacity and its historical contribution to the global automotive market, indicating sustained manufacturing strength rather than annual fluctuations.
Global automotive manufacturing is a cornerstone of industrial economies, with nations accumulating vast production volumes over decades. The long-term perspective on cumulative passenger car production reveals the strategic importance of this sector to national development and international trade. Understanding these historical trends provides insight into the shifts in global economic power and industrial leadership.
The Ascent of New Automotive Giants
The landscape of passenger car manufacturing has seen profound transformations. Historically, countries like Japan, Germany, and the United States were the undisputed leaders, establishing robust industrial ecosystems built on innovation and mass production. However, recent decades have witnessed the remarkable rise of new automotive powers. This surge is often driven by expanding domestic markets, significant foreign investment, and strategic national policies aimed at fostering industrial growth. The sheer scale of production in these emerging hubs has rapidly reshaped global rankings, reflecting a rebalancing of manufacturing capabilities and highlighting the dynamic nature of industrial expansion.
Established Manufacturing Strongholds
Despite the emergence of new players, traditional automotive manufacturing nations continue to hold substantial cumulative production figures. These countries benefit from deeply entrenched supply chains, highly skilled labor forces, and long-standing reputations for engineering excellence and quality. Their contributions to automotive technology and design have been foundational, setting benchmarks for the entire industry. Even as global production centers diversify, the legacy of these nations remains a critical component of the worldwide automotive infrastructure. The ongoing evolution in these regions includes a pivot towards electric vehicles and sustainable manufacturing practices, ensuring their continued relevance in a changing world. The United States, for instance, has leveraged its historical industrial might and consumer market size to maintain a significant presence, continually adapting to new technologies.
Economic Drivers and Global Market Dynamics
Cumulative passenger car production is intricately linked to a nation's economic development and its integration into global trade networks. Factors such as per capita income, consumer demand, and government support for the automotive sector play crucial roles. Countries with large domestic markets, coupled with strong export capabilities, tend to accumulate higher production volumes. Furthermore, globalized production strategies, where multinational corporations establish manufacturing facilities in various countries, significantly impact national production figures. These strategies are often influenced by labor costs, access to raw materials, proximity to key markets, and trade agreements. The interplay of these elements creates a complex web of dependencies and opportunities within the global automotive industry, with nations like the US serving as both major producers and consumers.
Technological Evolution and Production Capacity
The journey of passenger car production has been marked by continuous technological advancements. From the early days of assembly lines to the sophisticated robotics and automation prevalent today, innovations have consistently boosted efficiency and scale. Nations that invest heavily in research and development, and those that quickly adopt new manufacturing technologies, gain a competitive edge. The transition towards electric and autonomous vehicles represents the latest frontier, demanding new production methods, materials, and specialized skills. A nation's cumulative production figures reflect its historical capacity to adapt to these technological shifts and its commitment to maintaining a technologically advanced manufacturing base.
Geopolitical and Trade Influences
The automotive industry is also susceptible to geopolitical dynamics and trade policies. Tariffs, trade agreements, and international relations can significantly influence where cars are produced and exported. Countries with stable political environments and favorable trade policies often attract more automotive investment, leading to higher production volumes. Conversely, geopolitical tensions or protectionist measures can disrupt supply chains and shift manufacturing priorities. The strategic importance of the automotive sector, both for employment and economic output, often leads governments to implement policies designed to protect and promote domestic production, as observed in major economies worldwide.
Environmental Regulations and Sustainability
Increasing global awareness of environmental issues has profoundly impacted automotive production. Stricter emissions standards, targets for carbon neutrality, and a growing consumer preference for eco-friendly vehicles are pushing manufacturers towards more sustainable practices. This includes innovations in material science, energy-efficient production processes, and the development of electric and hybrid vehicles. Nations that proactively adapt to these environmental imperatives, fostering green manufacturing and promoting cleaner transportation, are likely to sustain their long-term production relevance. The cumulative production figures implicitly reflect the industry's journey through evolving environmental consciousness.
The Future of Automotive Manufacturing
Looking ahead, the automotive industry stands at the precipice of further monumental changes. The accelerating shift towards electric mobility, connected cars, and autonomous driving will redefine manufacturing processes and value chains. Countries that can effectively pivot their industrial capabilities towards these future technologies, fostering innovation and investing in the necessary infrastructure, will likely maintain or even enhance their positions in cumulative production. The ability to integrate advanced digital technologies, such as artificial intelligence and big data analytics, into manufacturing operations will be paramount for sustained leadership in the global automotive sector. The long-term accumulation of production is a testament to national resilience and adaptability in a constantly evolving industrial landscape.
Global Automotive Leadership
The global automotive landscape reveals a significant shift in passenger car manufacturing.
Key Takeaways
Global Shifts in Production Leadership
- The automotive industry has experienced a significant rebalancing of manufacturing power, with emerging economies rapidly ascending the ranks in cumulative passenger car production.
- Nations with large domestic markets and strategic industrial policies have seen substantial growth, altering the traditional hierarchy of global car manufacturing.
- This shift underscores the dynamic nature of industrial development and the increasing distributed nature of global manufacturing capabilities.
Enduring Influence of Established Automotive Nations
- Despite the rise of new players, traditional automotive powerhouses continue to hold substantial cumulative production volumes, benefiting from decades of expertise.
- Their strong foundations in engineering, robust supply chains, and established brand recognition remain critical assets in the global industry.
- These nations are also at the forefront of innovation, adapting to new technologies like electric vehicles and sustainable manufacturing.
Factors Shaping Cumulative Output
- Cumulative production is driven by a combination of economic strength, domestic demand, export capabilities, and a conducive policy environment.
- Technological advancements, from assembly line automation to digitalization, play a crucial role in enhancing manufacturing efficiency and scale.
- Geopolitical stability, trade policies, and evolving environmental regulations also significantly influence long-term production trends and investment decisions across nations.
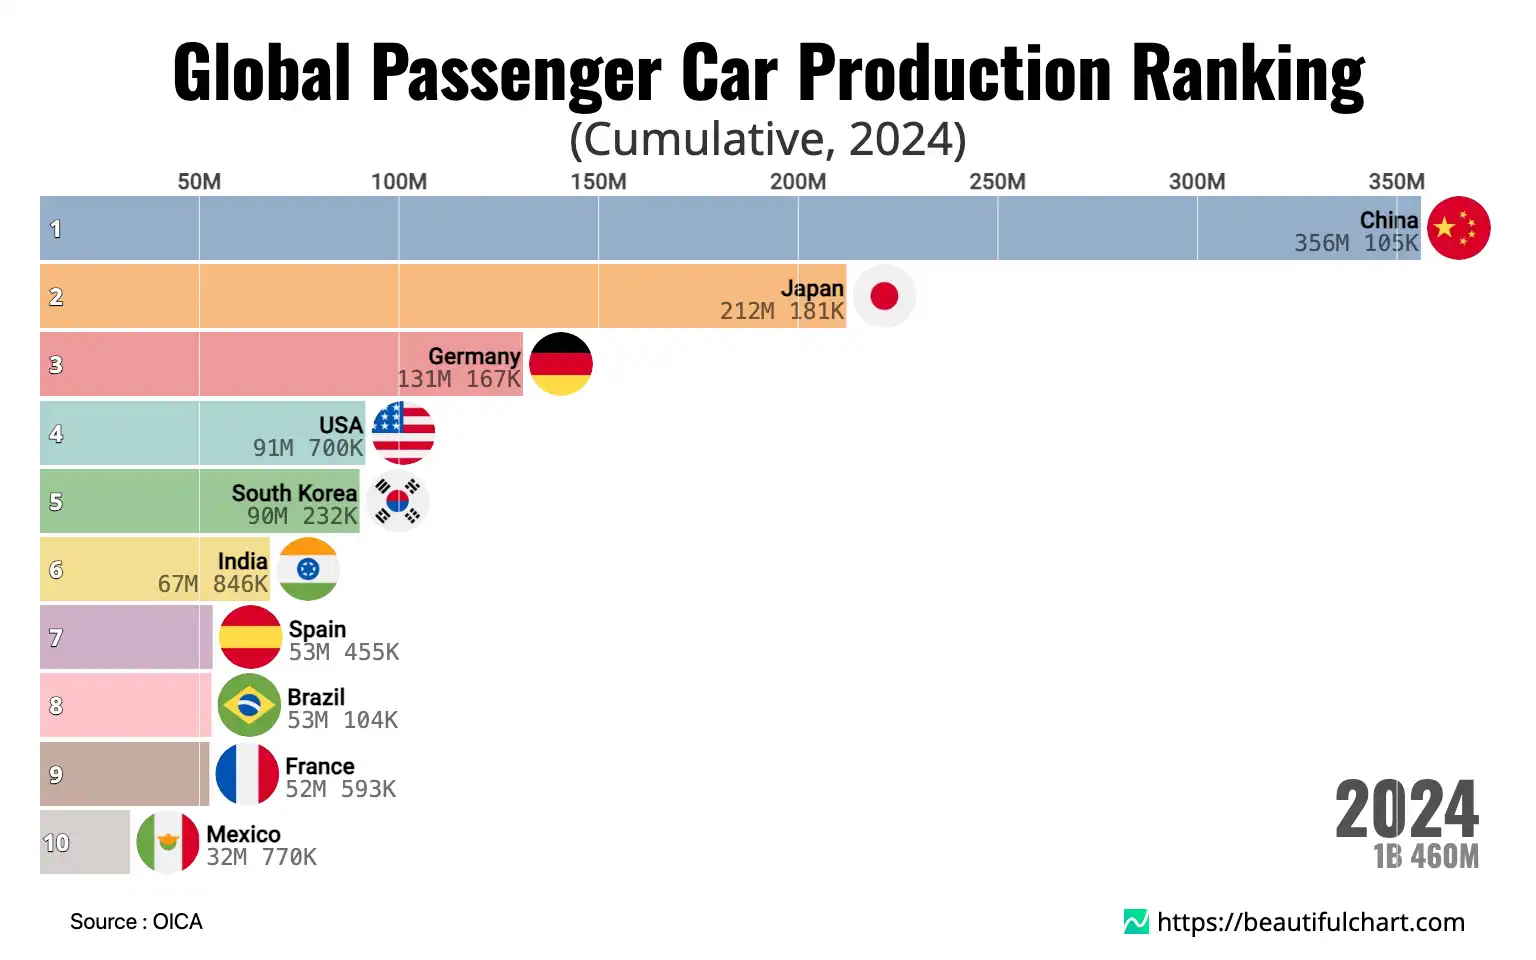
Top Ranking
1st China (356M 105K)
China has rapidly ascended to the top position in cumulative passenger car production, reflecting its massive domestic market and robust industrial expansion over the past few decades. The nation's strategic investments in manufacturing capabilities, coupled with substantial foreign direct investment and supportive government policies, have fueled this unprecedented growth. China's automotive industry is not only a key driver of its economy but also a major force in global supply chains, increasingly exporting vehicles and components worldwide. This phenomenal output signifies China's transformation into a dominant global automotive manufacturing hub.
2nd Japan (212M 181K)
Japan holds a distinguished legacy as a global automotive powerhouse, known for its innovation, efficiency, and quality manufacturing. Despite the rise of other nations, Japan maintains a strong cumulative production volume, underscoring its long-standing expertise and technological leadership in the industry. Japanese manufacturers are renowned for pioneering lean production systems and developing fuel-efficient, reliable vehicles that have captured markets worldwide. The nation's automotive sector continues to be a cornerstone of its economy, adapting to new challenges and leading advancements in hybrid and electric vehicle technologies.
3rd Germany (131M 167K)
Germany stands as Europe's automotive manufacturing giant, boasting a rich history of engineering excellence and luxury vehicle production. Its cumulative output reflects decades of precision manufacturing, technological innovation, and a strong export-oriented industry. German brands are globally recognized for their performance, design, and advanced engineering, catering to both premium and mainstream segments. The country's robust network of suppliers, skilled workforce, and commitment to research and development have ensured its enduring position as a top-tier automotive producer, with ongoing focus on electrification and digitalization.
4th USA (91M 700K)
The United States has a foundational role in the history of passenger car manufacturing, being the birthplace of mass production and a key innovator in automotive design and technology. Its substantial cumulative production reflects a long period of industrial leadership, driven by a large domestic market and significant technological advancements. While the manufacturing landscape has evolved globally, the U.S. remains a vital hub for automotive production, attracting major investments from both domestic and international manufacturers. The industry contributes significantly to the national economy, with a strong emphasis now on electric vehicles and advanced manufacturing processes.
5th South Korea (90M 232K)
South Korea has emerged as a significant force in the global automotive industry, achieving impressive cumulative production volumes through rapid industrialization and strategic development. The nation's automotive sector is characterized by a strong focus on advanced technology, design, and aggressive market expansion. South Korean brands have successfully penetrated global markets by offering competitive, feature-rich vehicles with increasing reliability and quality. The industry is a major pillar of the national economy, continuously investing in future mobility solutions, including electric and hydrogen fuel cell vehicles, to maintain its competitive edge.
| Rank | Name | Indicator |
|---|---|---|
1 | 356M 105K | |
2 | 212M 181K | |
3 | 131M 167K | |
4 | 91M 700K | |
5 | 90M 232K | |
6 | 67M 846K | |
7 | 53M 455K | |
8 | 53M 104K | |
9 | 52M 593K | |
10 | 32M 770K | |
11 | 31M 795K | |
12 | 31M 289K | |
13 | 24M 535K | |
14 | 19M 472K | |
15 | 18M 735K | |
16 | 18M 393K | |
17 | 17M 705K | |
18 | 16M 794K | |
19 | 16M 188K | |
20 | 14M 539K |


