The global landscape of competitive gaming showcases distinct financial leadership among nations, based on cumulative prize money. China stands at the forefront, having amassed the largest total winnings, highlighting its significant investment and success in professional esports. The United States follows closely, representing a substantial player base and considerable prize pool contributions across various gaming titles, solidifying its position as a major force in the industry.
Esports Prize Money: This refers to the total financial rewards distributed to professional players and teams for their performance in competitive video gaming tournaments. Cumulative prize money represents the aggregate earnings across all recorded professional events for players affiliated with a specific country.
The economic impact and global reach of esports have grown exponentially over the past decades, transforming competitive video gaming into a multi-billion-dollar industry. A key indicator of a nation's dominance and engagement in this sector is the cumulative prize money won by its professional players. This metric not only reflects the skill and dedication of individual athletes but also the underlying infrastructure, investment, and cultural support for esports within a country.
The distribution of cumulative prize money worldwide reveals fascinating insights into the geographical strongholds of competitive gaming. While individual player skill is paramount, the overall success of a nation often correlates with factors such as the size of its gaming population, the prevalence of professional esports organizations, governmental or private sector investment, and the availability of high-quality training facilities and coaching. Countries that have successfully nurtured a robust esports ecosystem tend to see their players consistently perform well at international tournaments, leading to substantial collective earnings.
East Asian nations, particularly China and South Korea, have historically been pioneers and powerhouses in esports. Their early adoption of competitive gaming, coupled with a deep-rooted gaming culture, has created an environment conducive to producing top-tier talent. These countries often boast dedicated esports academies, a vast pool of aspiring players, and a strong spectator base, all of which contribute to their high rankings in cumulative prize money. The sheer scale of participation and the intensity of competition within these regions drive innovation and excellence, further cementing their global standing.
North America, led by the United States, and several European countries have also established themselves as major players. The United States, with its diverse player base and substantial commercial investments, commands a significant share of global prize money. Its success is often attributed to a strong collegiate esports scene, numerous professional leagues, and a culture that increasingly recognizes esports as a legitimate professional career path. European nations like Denmark, Russia, and Sweden, despite smaller populations compared to giants like China or the US, consistently rank high due to their specialized expertise in specific game titles and the prevalence of highly skilled individual players and teams.
Beyond the top-tier nations, the growth of esports is a global phenomenon, with emerging markets in South America (e.g., Brazil) and Southeast Asia also making their mark. Brazil, for instance, exhibits a passionate fanbase and a growing professional scene, demonstrating the global spread of esports influence. These regions are often characterized by rapidly expanding internet infrastructure and a young, digitally native population eager to engage with competitive gaming, both as players and spectators.
Factors such as the type of games popular in a region also influence prize money distribution. For example, some countries might excel in Real-Time Strategy (RTS) games, while others dominate Multiplayer Online Battle Arenas (MOBAs) or First-Person Shooters (FPS). The prize pools associated with these different game genres can vary significantly, impacting a nation's total earnings. Furthermore, the number of professional tournaments hosted within a country, and the prize money offered at these events, can also contribute to the overall cumulative figures.
The continuous evolution of the esports industry, marked by increasing viewership, larger sponsorships, and expanding media coverage, suggests that cumulative prize money will continue to grow. This growth is expected to further democratize access to professional gaming, potentially allowing more countries to develop their esports talent and climb the global rankings. The ongoing professionalization of the industry, with structured leagues and player associations, also plays a crucial role in ensuring the sustainability and financial viability of esports careers globally.
Global Esports
The global landscape of competitive gaming showcases distinct financial leadership among nations, based on cumulative prize money.
Key Takeaways
Global Esports Financial Leaders
- China demonstrates significant dominance in the global esports arena, leading all nations in cumulative prize money earnings, which underscores its substantial investment and vast player base.
- The United States secures a strong second position, indicating a robust and diverse esports ecosystem with a large number of professional players contributing to substantial winnings.
- South Korea maintains its legacy as a top-tier esports nation, ranking third with impressive cumulative earnings, reflecting its pioneering role and continued excellence in competitive gaming.
Regional Strengths and Emerging Markets
- The top rankings highlight the established powerhouses in East Asia and North America, showcasing the regions with the most developed esports infrastructure and professional talent.
- European nations like Russia and Denmark also feature prominently, demonstrating strong individual player skills and dedicated communities in specific game titles.
- Brazil's presence in the top five indicates the growing influence and development of esports markets in South America, driven by passionate fanbases and increasing participation.
Factors in National Success
- A nation's cumulative prize money is influenced by various factors including the number of professional players, the level of national investment in esports infrastructure, and cultural acceptance of gaming as a profession.
- Success in specific, high-prize-pool game titles can significantly boost a country's overall earnings, as can the consistent performance of top-tier teams and athletes in international competitions.
Top Ranking
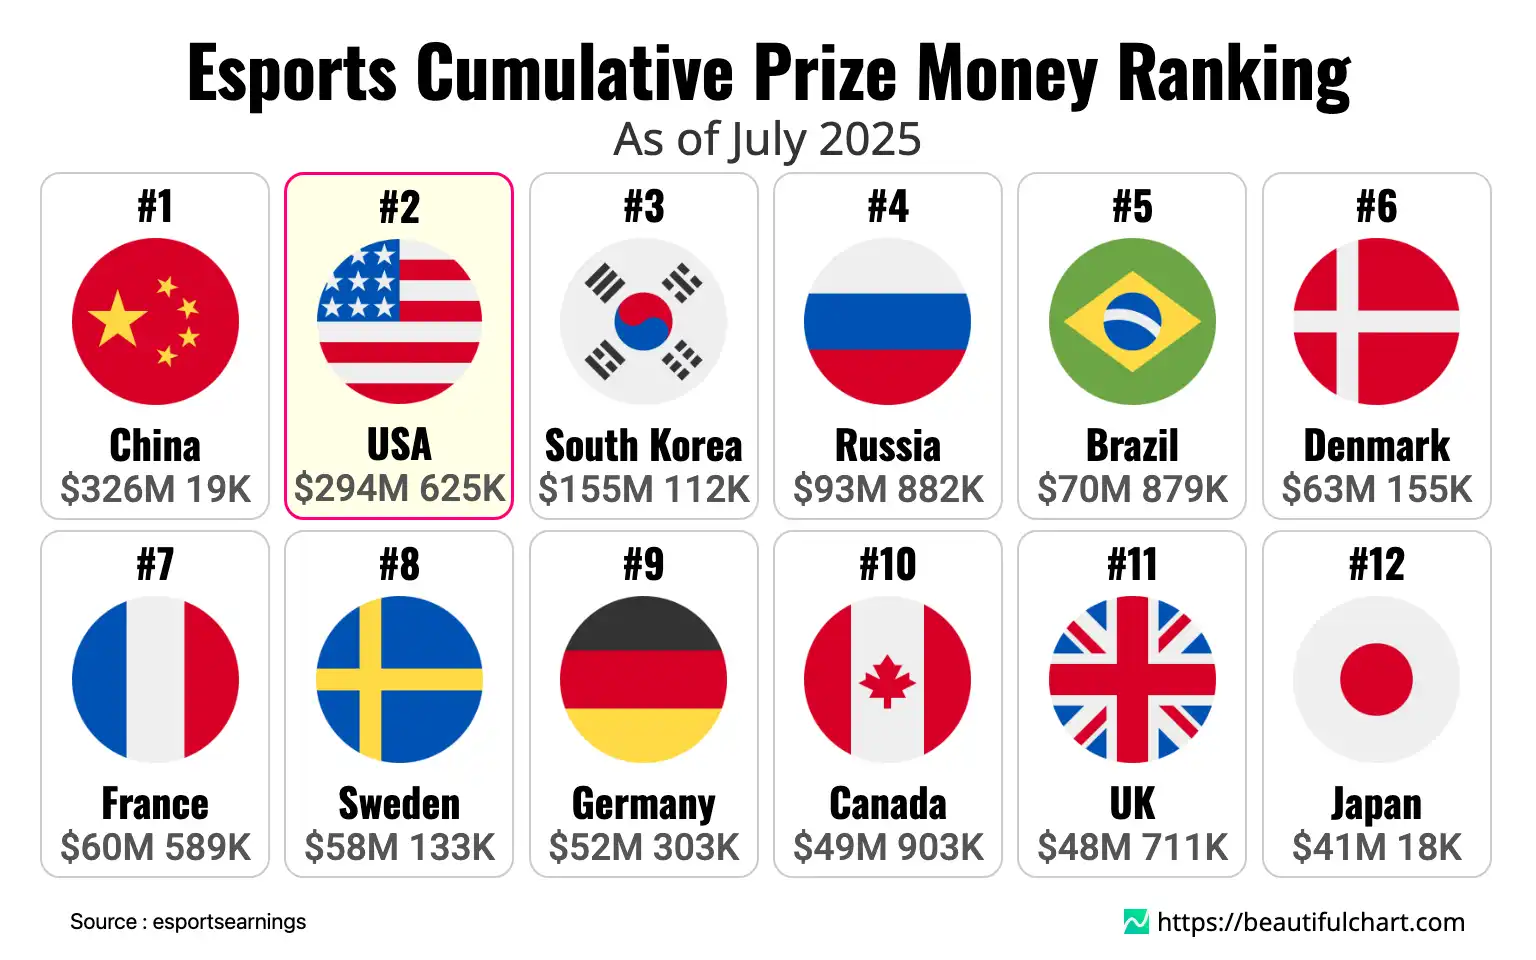
1st China: $326M
China stands as the undisputed leader in cumulative esports prize money, boasting an astonishing $326 million in winnings. This dominant position is a testament to the nation's massive player base, extensive investment in esports infrastructure, and the widespread popularity of competitive gaming. With over 9,000 professional players contributing to this sum, China consistently produces top-tier talent across various major game titles, securing numerous championships and solidifying its status as a global esports powerhouse.
2nd USA: $294M
The United States ranks second with a cumulative prize money total of $294 million, showcasing its robust and dynamic esports scene. While its total winnings are slightly less than China's, the U.S. features a significantly larger player base, with nearly 29,000 unique players contributing to this impressive sum. This broad participation reflects a highly developed ecosystem, strong corporate sponsorships, a burgeoning collegiate esports circuit, and a widespread cultural embrace of professional gaming, allowing a diverse range of titles to flourish.
3rd South Korea: $155M
South Korea, a pioneer in the esports industry, secures the third position with $155 million in cumulative prize money. Despite having a smaller player pool of nearly 6,000 professionals compared to China and the U.S., South Korea's per-player earnings are exceptionally high, underscoring its unparalleled skill and strategic prowess, particularly in games like StarCraft and League of Legends. Its consistent presence in global finals and a strong tradition of rigorous training and competitive excellence ensure its continued prominence in the global rankings.
4th Russia: $93M
Russia holds the fourth spot with $93 million in cumulative esports prize money, driven by a strong presence in popular titles and a dedicated player community. With over 5,800 players, Russia has consistently produced highly skilled individuals and teams, particularly in games with significant European and CIS region participation. The nation's esports scene benefits from passionate fans and growing investment, allowing its professional players to compete effectively on the international stage and secure substantial winnings.
5th Brazil: $70M
Brazil rounds out the top five with $70 million in cumulative prize money, highlighting its emerging power in the global esports landscape. Boasting a substantial player base of nearly 5,900 professionals, Brazil's success is fueled by a rapidly growing and enthusiastic gaming community, particularly in titles like Counter-Strike: Global Offensive and League of Legends. The country's increasing engagement in professional tournaments and the rise of local talent underscore its potential as a significant force in the future of competitive gaming.
| Rank | Name | Indicator |
|---|---|---|
1 | $ 326M 19K | |
2 | $ 294M 625K | |
3 | $ 155M 112K | |
4 | $ 93M 882K | |
5 | $ 70M 879K | |
6 | $ 63M 155K | |
7 | $ 60M 589K | |
8 | $ 58M 133K | |
9 | $ 52M 303K | |
10 | $ 49M 903K | |
11 | $ 48M 711K | |
12 | $ 41M 18K | |
13 | $ 39M 791K | |
14 | $ 34M 1K | |
15 | $ 33M 677K | |
16 | $ 31M 433K | |
17 | $ 30M 874K | |
18 | $ 24M 938K | |
19 | $ 22M 899K | |
20 | $ 22M 799K |


