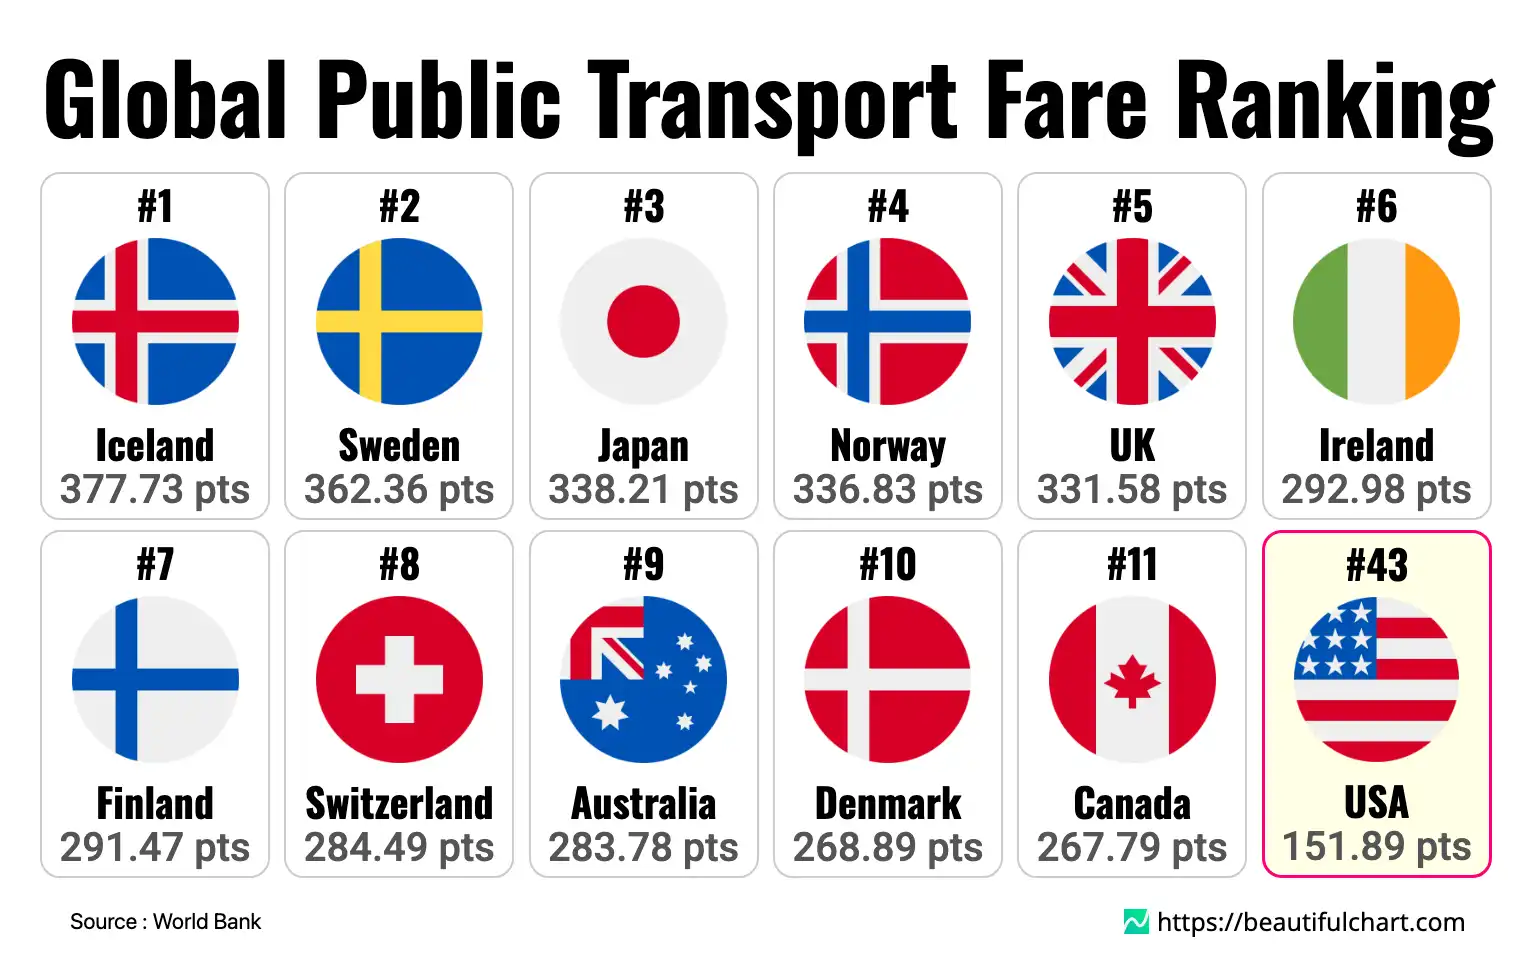
Iceland leads the world with the most expensive public transportation, with a price index of 377.73 points. It is closely followed by other developed nations like Sweden, Japan, and Norway, which also feature in the top ranks. This data reveals a significant global disparity in travel costs, where European and East Asian countries dominate the higher end of the scale. In contrast, the United States ranks 43rd with a score of 151.89, indicating more moderate public transportation expenses compared to the leading countries.
The Public Transportation Price Index is a composite measure used to compare the cost of public transit across different countries. It typically factors in the average prices of one-way tickets and monthly passes, providing a standardized score to gauge affordability and cost of living. A higher index score signifies more expensive public transportation.
The cost of public transportation varies dramatically across the globe, reflecting a complex interplay of economic development, government policy, urban geography, and infrastructure investment. This global comparison highlights distinct patterns, with a clear concentration of high-cost nations in Europe and parts of Asia, while developing countries generally feature much lower prices.
The High Cost of Mobility in Developed Nations
Countries at the top of the price scale, such as Iceland, Sweden, Japan, and the UK, share several common characteristics. They typically boast highly developed, efficient, and technologically advanced public transit networks. These systems require enormous capital investment for construction and continuous funding for maintenance, upgrades, and operations. Furthermore, high labor costs, including wages and benefits for transit workers, are a significant driver of overall expenses in these economies. The quality of service—punctuality, cleanliness, safety, and extensive coverage—is often a priority, and this premium service level is reflected in ticket prices. In many of these nations, while some level of government subsidy exists, a substantial portion of the operational cost is passed on to the consumer to ensure financial sustainability.
The Economic Divide in Transit Pricing
A stark contrast is visible when comparing the top-ranking countries with those at the bottom. Nations with the lowest public transportation costs are predominantly in Africa, South Asia, and the Middle East. This difference is strongly correlated with the overall economic status of a country. Lower wages, less complex and sometimes aging infrastructure, and different government subsidy models contribute to cheaper fares. In many developing economies, public transit is an essential lifeline for a large segment of the population, making affordability a critical policy objective. Consequently, governments may heavily subsidize fares to ensure access, even if it means operating at a loss. This economic divide underscores how public transportation is not just a service but also a reflection of national wealth and social priorities.
The North American Model and the US Position
The United States, ranking 43rd, presents a unique case largely shaped by its car-centric culture and urban sprawl. Unlike many European and Asian countries with dense cities built around public transit, many American cities were designed for automobiles. As a result, public transportation systems can be less comprehensive and receive inconsistent funding. While major metropolitan areas like New York City or San Francisco have extensive and relatively expensive transit systems, many other parts of the country have limited or basic services. This variability contributes to a moderate national average. The ranking suggests that while transit in major US cities can be costly, it does not reach the premium prices seen in the top-tier European nations, reflecting different priorities in urban planning and transportation investment.
Global Public Transportation Price Ranking
Iceland leads the world with the most expensive public transportation, with a price index of 377.
Key Takeaways
European Countries Dominate High-Cost Rankings
- Several European nations, including Iceland, Sweden, and Norway, occupy the top positions for the most expensive public transportation.
- This trend reflects high operational costs, extensive and modern infrastructure, and higher wages in these developed economies.
- The quality of service, investment in sustainable technology, and government subsidy levels are key factors influencing final ticket prices for consumers.
Significant Global Disparity in Transit Costs
- A vast gap exists between the highest-ranking countries and those at the bottom of the list, such as Syria and Ethiopia.
- This disparity is strongly correlated with national economic status, with wealthier countries generally having higher transportation prices.
- Factors like fuel costs, vehicle maintenance, labor expenses, and the degree of government subsidization contribute to the wide range of prices observed worldwide.
Top Ranking
1st Iceland 377.73 pts
Iceland's position as the most expensive country for public transportation is driven by its high overall cost of living, sparse population density, and challenging geography. The system relies heavily on buses, as there is no public railway. Operating and maintaining a reliable bus network across long distances with a small population base is inherently costly. Furthermore, high wages for drivers and maintenance staff, coupled with the expense of importing vehicles and fuel, contribute significantly to the premium fares.
2nd Sweden 362.36 pts
Sweden's high ranking reflects its commitment to high-quality, efficient, and sustainable public transport. Major cities like Stockholm boast extensive and integrated networks of trains, buses, and ferries that are clean, punctual, and technologically advanced. This high standard of service requires significant ongoing investment. Sweden's strong economy also means higher labor costs, which form a substantial part of the operational budget. While subsidized, the system is designed to have users bear a significant portion of the cost.
3rd Japan 338.21 pts
Japan is renowned for its world-class public transportation system, particularly its incredibly punctual and extensive railway network, including the famous Shinkansen (bullet train). The price reflects the exceptional quality, reliability, and coverage of this service. The system is operated by multiple private and public companies that invest heavily in cutting-edge technology and meticulous maintenance. High operational standards and labor costs in a developed economy contribute to the expensive fares, which passengers pay for unparalleled efficiency.
4th Norway 336.83 pts
Similar to Iceland, Norway's high transportation costs are influenced by its difficult terrain, high standard of living, and high wages. Maintaining roads, railways, and ferry services through mountains and across fjords is an expensive endeavor. The country is also a leader in adopting environmentally friendly transportation, such as electric ferries and buses, which involves high initial investment costs. These factors, combined with a commitment to quality service, result in some of the highest transit fares in the world.
5th UK 331.58 pts
Public transportation costs in the United Kingdom, particularly in England, are among the highest globally. This is largely attributed to the privatized railway system, where fares are set by train operating companies to generate profit. Prices can vary significantly by region, with London's extensive network being particularly expensive. Factors such as aging infrastructure requiring constant and costly upgrades, high operational expenses, and the structure of government subsidies all contribute to the high ticket prices faced by commuters.
43rd USA 151.89 pts
The United States' moderate ranking reflects its diverse and fragmented public transportation landscape. Unlike countries where public transit is a national priority, the US is largely car-dependent. Major cities like New York and San Francisco have extensive but expensive systems, while many suburban and rural areas have limited or no service. This inconsistency pulls the national average down. Funding models vary greatly by state and city, leading to a wide range of pricing and service quality that, on the whole, is less costly than in the top-tier nations.
| Rank | Name | Indicator |
|---|---|---|
1 | 377.73 pts | |
2 | 362.36 pts | |
3 | 338.21 pts | |
4 | 336.83 pts | |
5 | 331.58 pts | |
6 | 292.98 pts | |
7 | 291.47 pts | |
8 | 284.49 pts | |
9 | 283.78 pts | |
10 | 268.89 pts | |
11 | 267.79 pts | |
12 | 256.17 pts | |
13 | 251.93 pts | |
14 | 250.79 pts | |
15 | 239.07 pts | |
16 | 238.41 pts | |
17 | 226.19 pts | |
18 | 211.68 pts | |
19 | 208.53 pts | |
20 | 203.33 pts |


