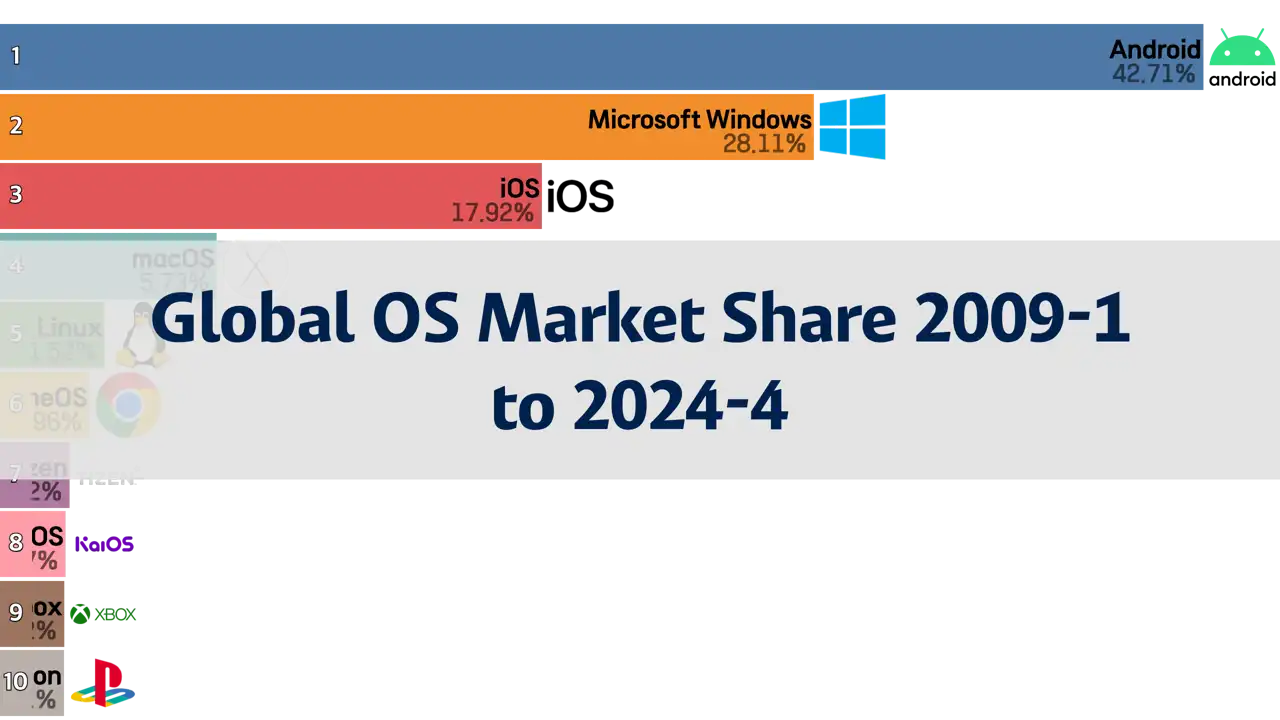
This chart displays the changes in market share for various operating systems worldwide from January 2009 to April 2024. It tracks the competitive landscape among major operating systems, highlighting shifts in market dominance over time. This period reflects significant technological shifts and changes in consumer preferences, illustrating the rise and fall of different operating systems.
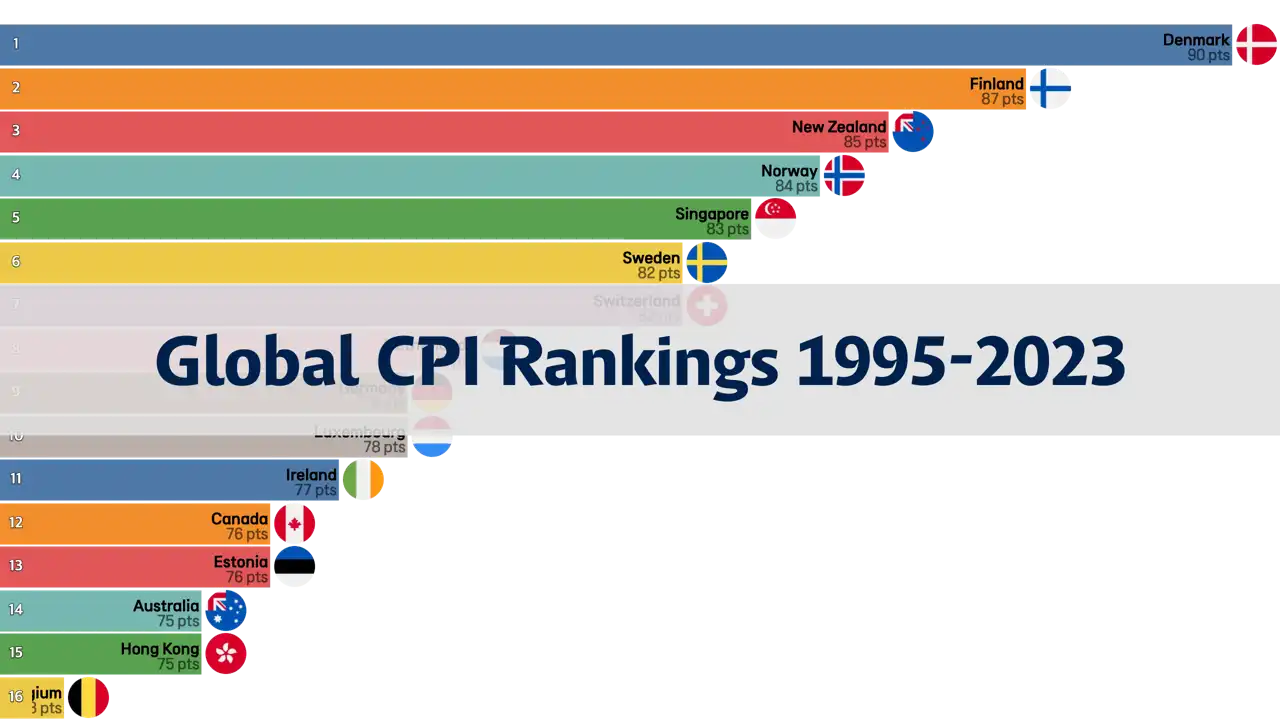
The Corruption Perceptions Index (CPI) measures the perceived levels of public sector corruption according to experts and businesspeople around the world. This chart presents the annual rankings from 1995 to 2023, showing how perceptions of corruption have evolved globally over nearly three decades. It highlights significant changes and trends in how countries are viewed in terms of corruption.
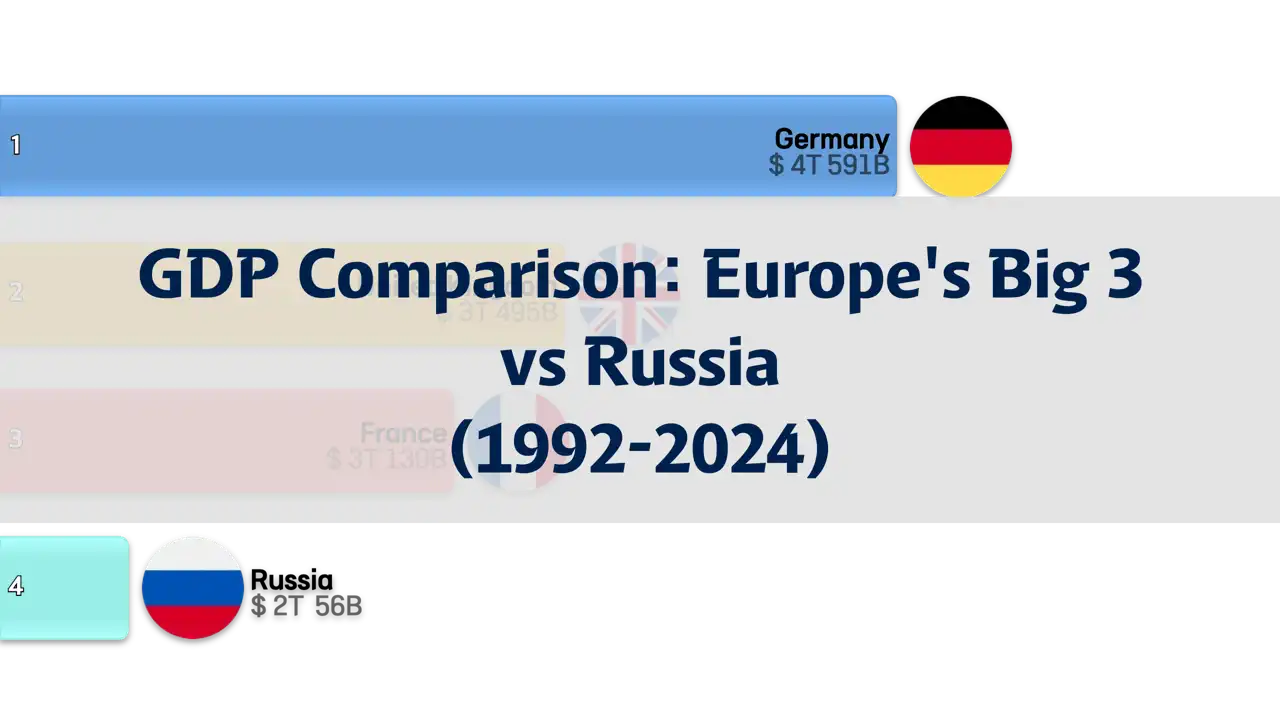
This chart illustrates the GDP comparison between Europe's Big 3 economies (Germany, France, the UK) and Russia from 1992 to 2024. It visually presents the economic growth trends and changes in GDP size of these nations, allowing for an analysis of their economic standing and growth patterns over time. This comparison sheds light on the economic conditions and shifting influences of major European countries and Russia within the global economic landscape.
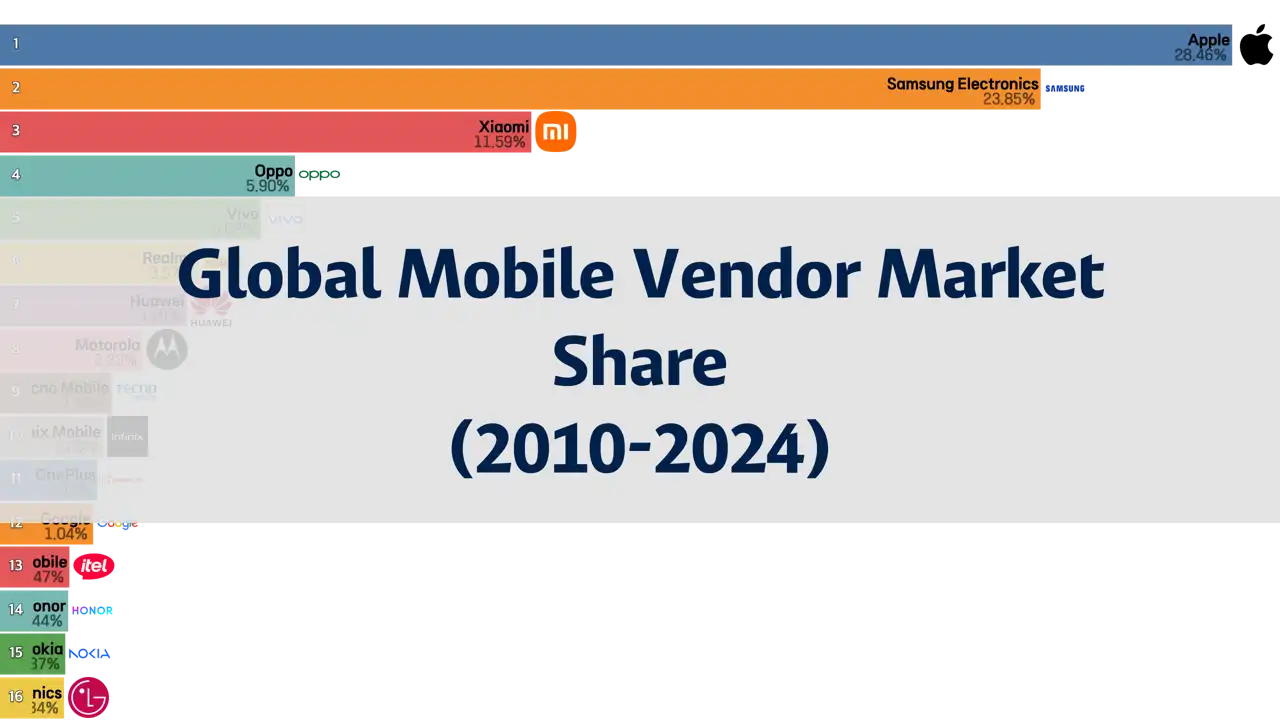
This chart displays the market share of mobile vendors worldwide from 2010 to 2024. It tracks changes in market share among different mobile manufacturers, illustrating how consumer preferences and technological advancements have influenced market competition. This data provides insights into the positioning of each vendor in the market, competitive dynamics, and the emergence and market share fluctuations of new players over time.
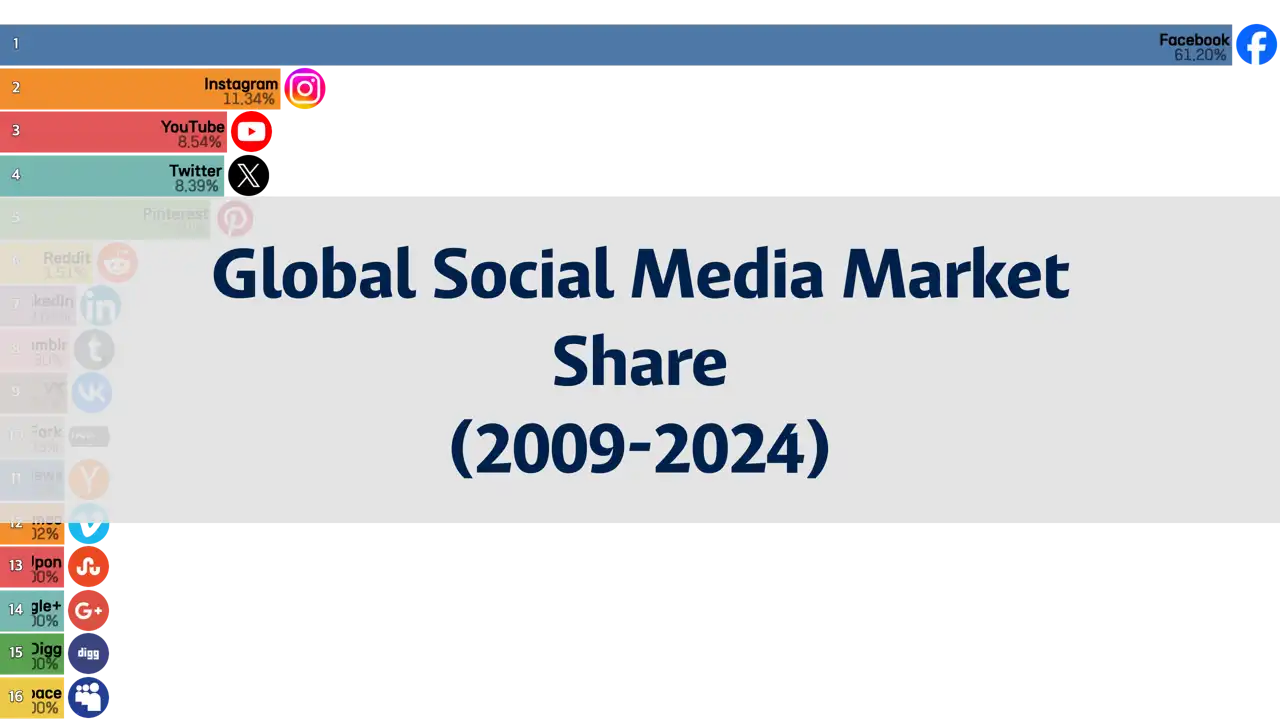
This chart displays the market share of social media platforms worldwide from 2009 to 2024. It tracks the growth and changes in user bases of various platforms, illustrating their popularity and position in the market over time. The data reflects the competitive landscape among social media platforms, analyzing the emergence of new platforms and the growth or decline trends of existing ones.
This chart displays the GDP comparison between Taiwan and Southeast Asian countries from 1980 to 2024. It illustrates the economic growth trends of Taiwan and key Southeast Asian nations, analyzing the rates of economic growth and changes in GDP size. This comparison helps to clearly understand the pace and patterns of economic development in Taiwan and Southeast Asian countries over the designated period.
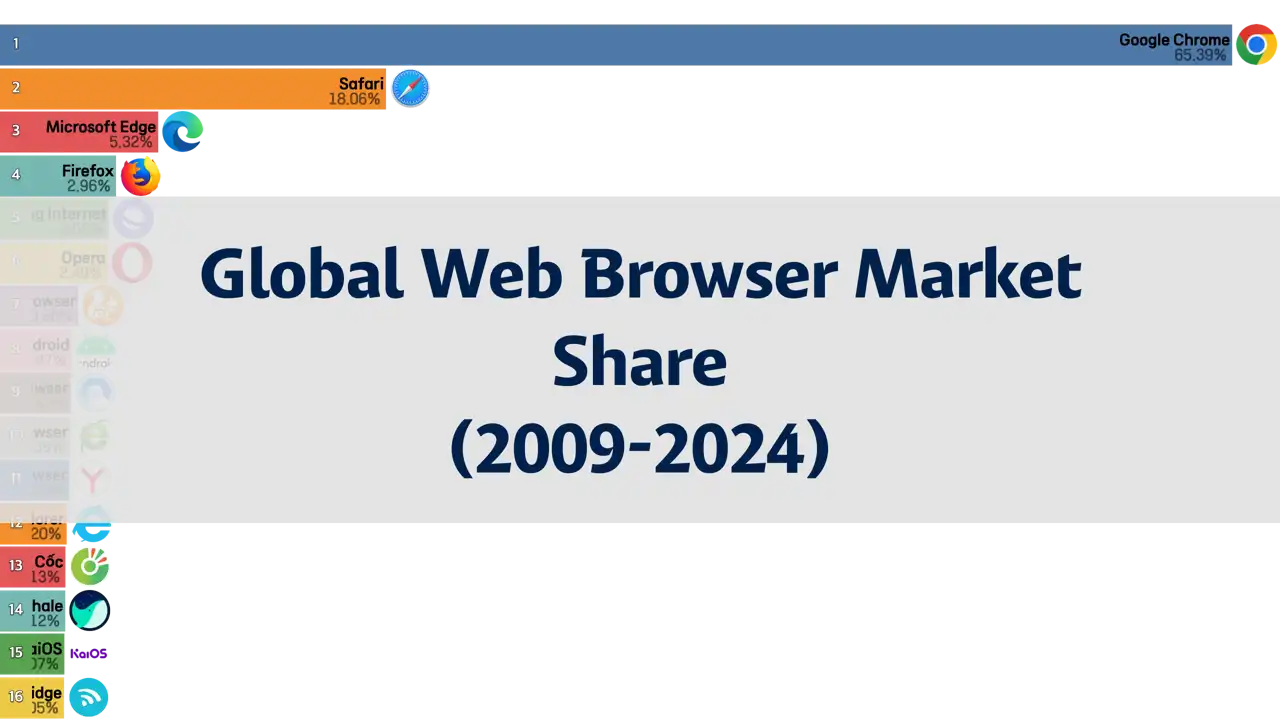
This chart presents the market share of web browsers worldwide from 2009 to 2024, highlighting how user preferences and technological advancements have influenced browser choices over time. The data reflects the competitive landscape among browser developers, showing how innovations and efforts to improve user experience have impacted market shares. This visualization provides insights into the rise and decline of various browsers throughout the period.
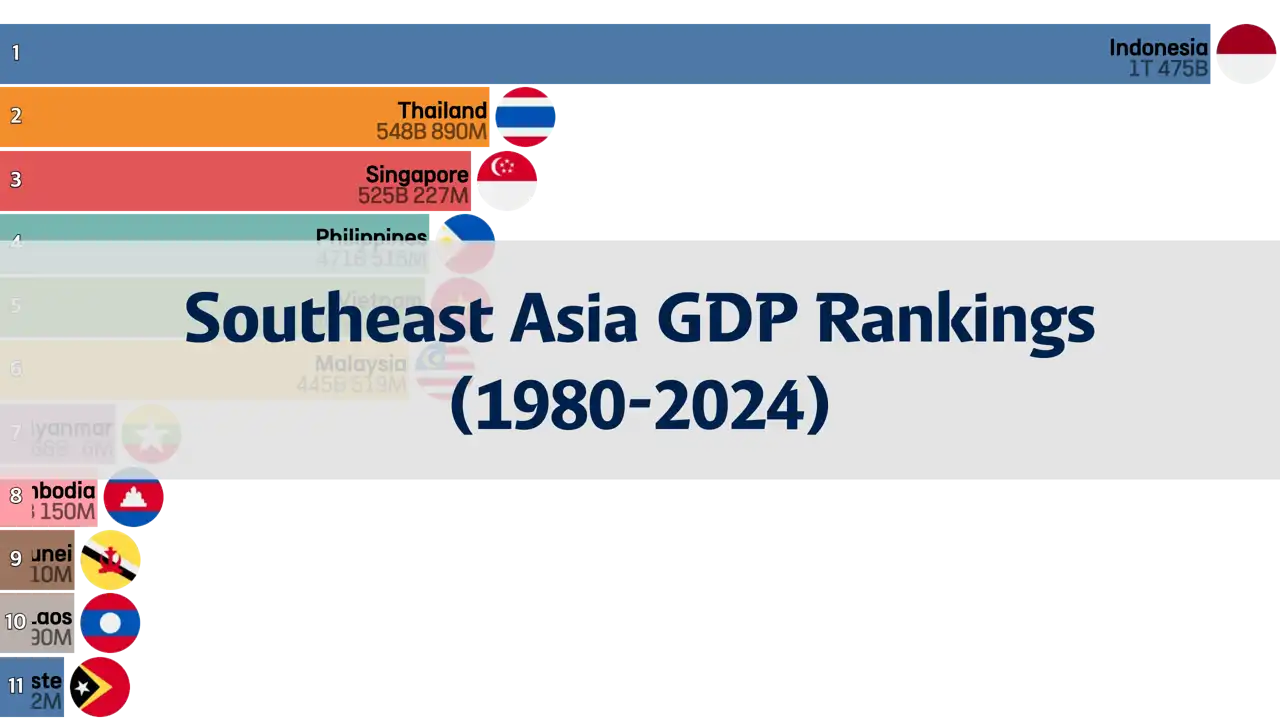
This chart displays the GDP rankings of Southeast Asian countries from 1980 to 2024. The data illustrates the economic growth trends of each country in the region, visually representing how the size of each nation's economy has evolved over time. Through this chart, it is possible to compare countries that have experienced significant economic development with those where growth has been more modest.
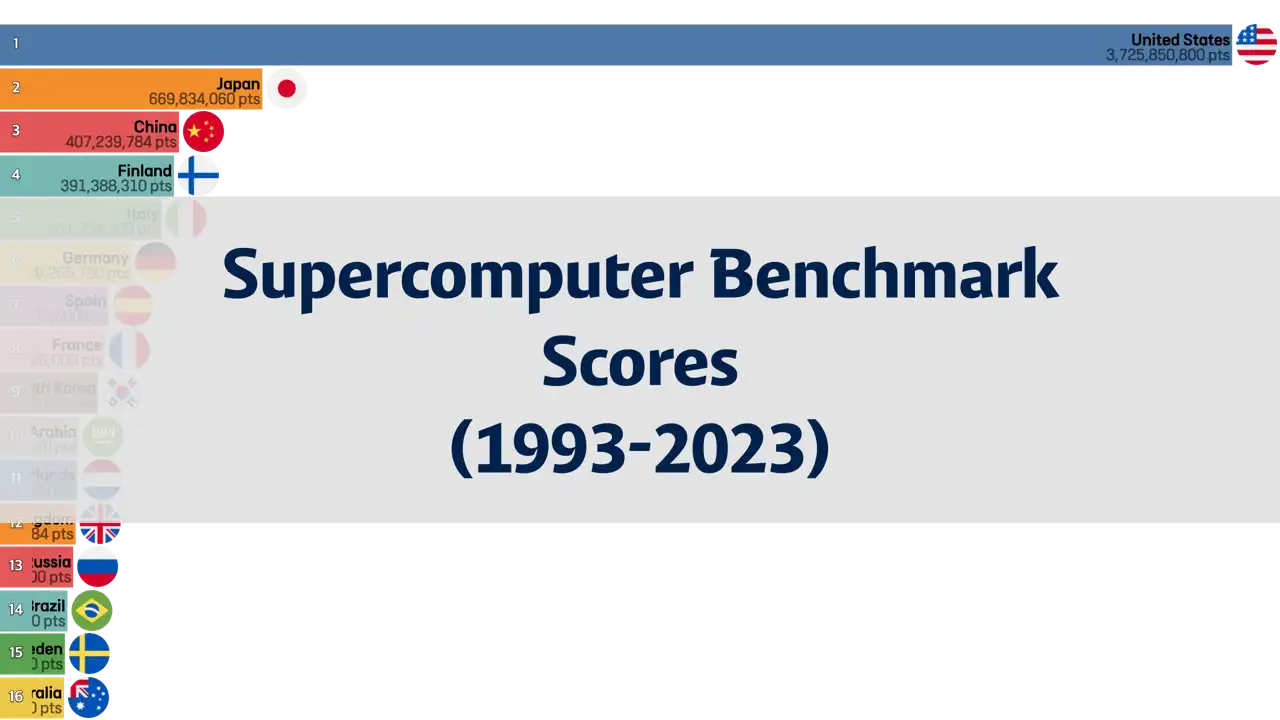
This chart presents the rankings based on benchmark scores of the world's supercomputers from 1993 to 2023. Standardized benchmark tests are used to measure the performance of each supercomputer, providing a crucial metric for evaluating their processing power and efficiency. The chart illustrates the evolution of supercomputer technology and performance enhancements over time, highlighting the most powerful computing resources of each era.
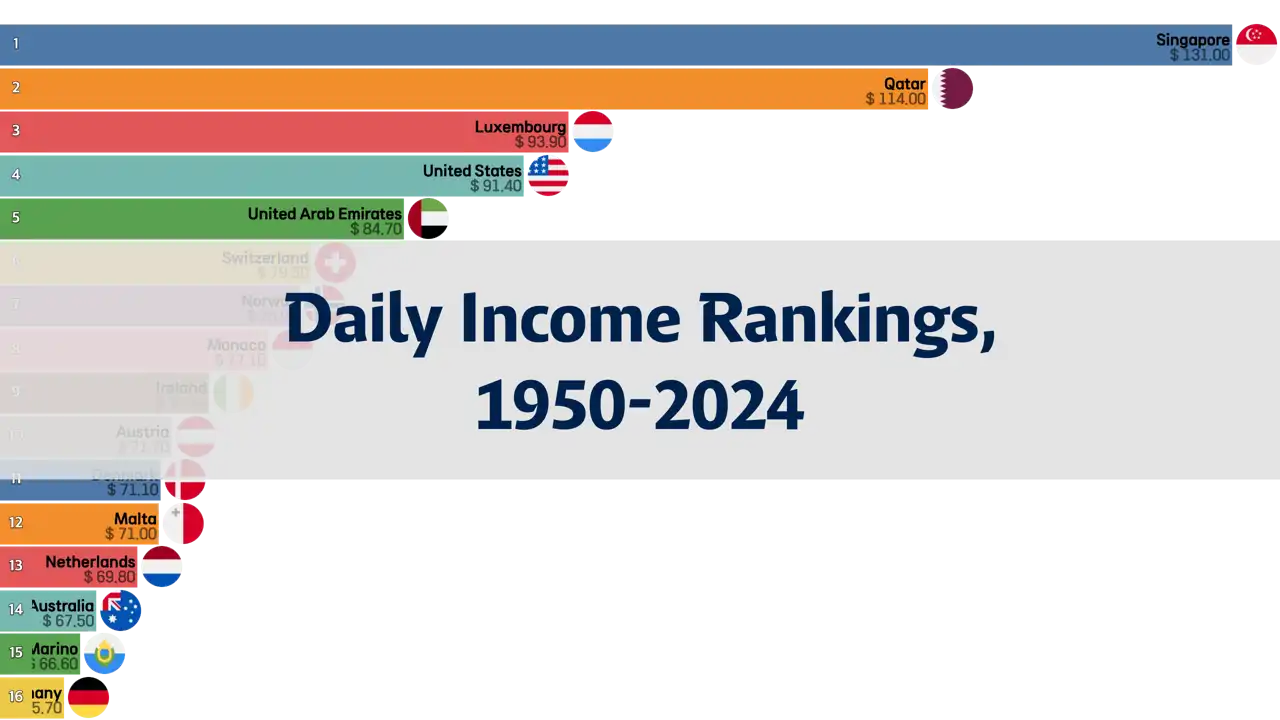
This chart displays the rankings of average daily income by country from 1950 to 2024. Over this period, the chart illustrates changes in economic growth and living standards through daily income levels, providing a snapshot of how economies have developed and income disparities have evolved. It visually represents the position of each country within the global economy and highlights shifts in economic power and wealth distribution.
This chart shows the ranking of players with the most goals in Europe's top 5 football leagues (Premier League, La Liga, Bundesliga, Serie A, Ligue 1) from the 2013/14 season to the 2022/23 season. This period serves as an important indicator of each player's scoring ability and consistency, with a high number of goals signifying superior offensive performance across Europe's elite football leagues. The chart provides insight into the top scorers in European football and their goal-scoring trends over this time.
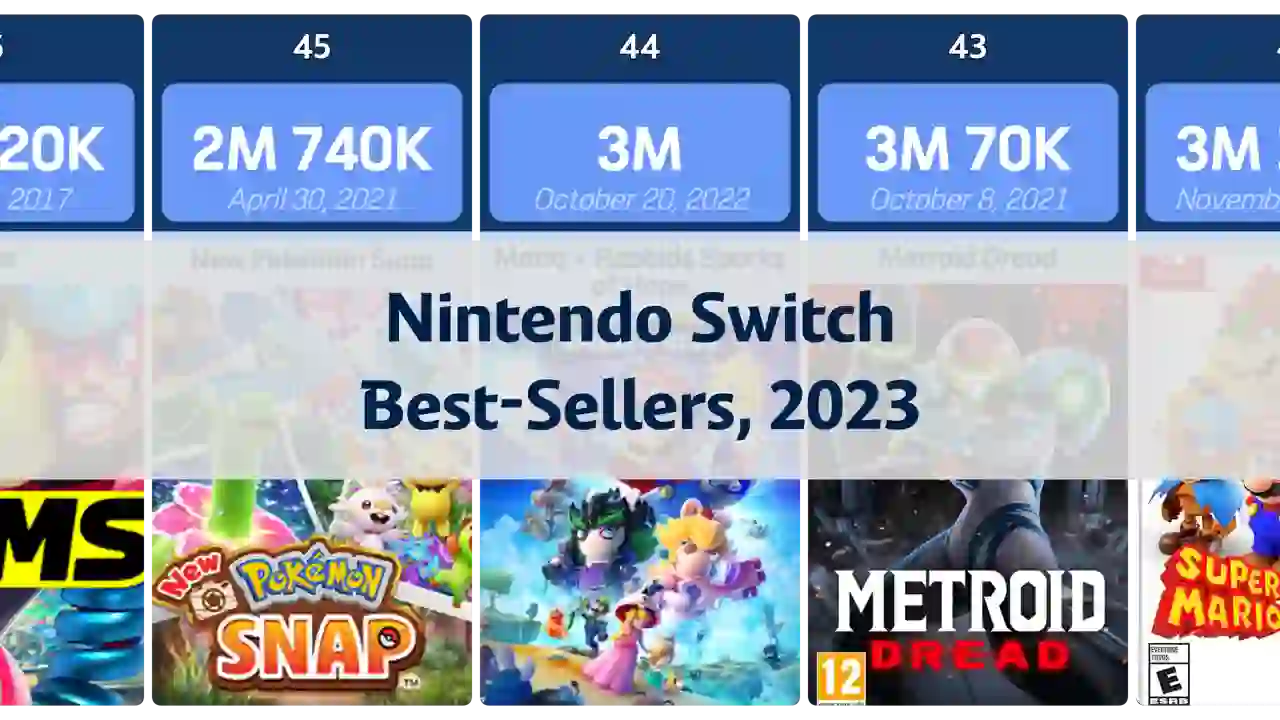
This chart displays the best-selling games on the Nintendo Switch platform as of 2023. This data highlights the popularity and market success of the Nintendo Switch, showcasing how diverse genres and the creative efforts of developers have captivated audiences and generated sales. These top-selling games have garnered high acclaim among Nintendo Switch users, known for leveraging the platform's unique features to the fullest.
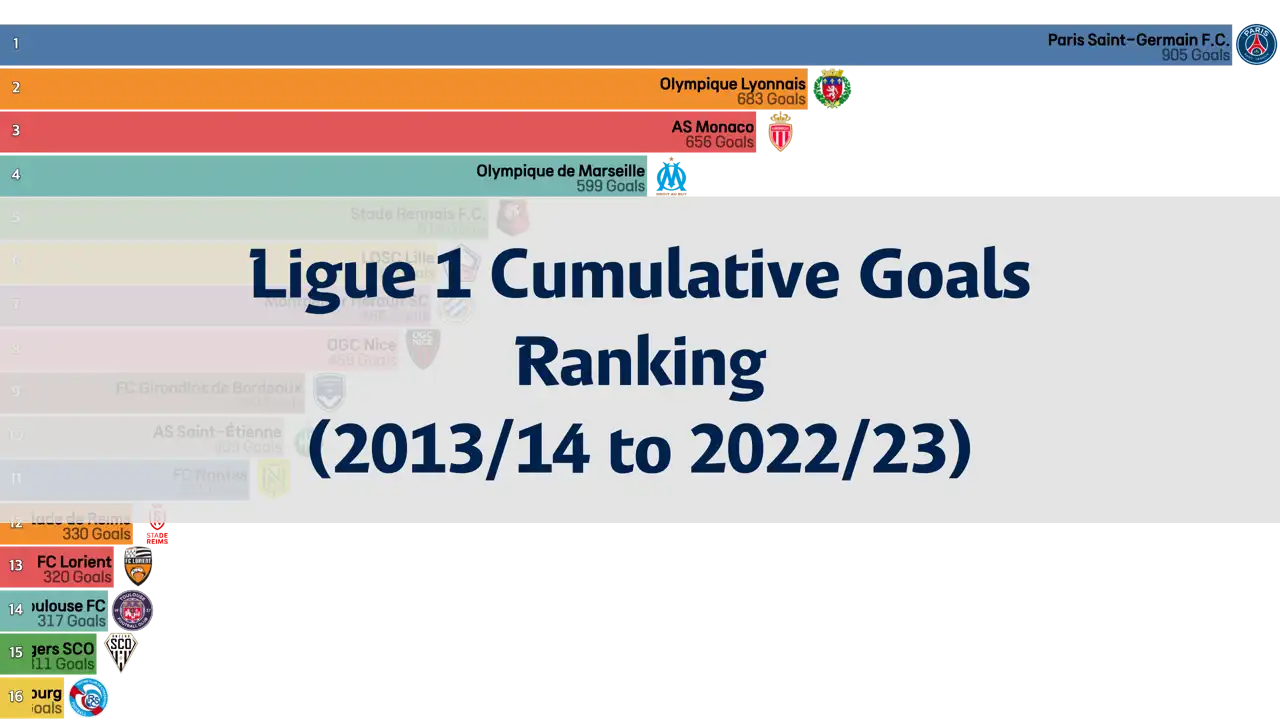
This chart shows the ranking of players with the most goals in France's Ligue 1 from the 2013/14 season to the 2022/23 season. This period serves as an important indicator of each player's scoring ability and consistency, with a high number of goals signifying superior offensive performance in France's top football league. The chart provides insight into the top scorers in Ligue 1 history and their goal-scoring trends over time.
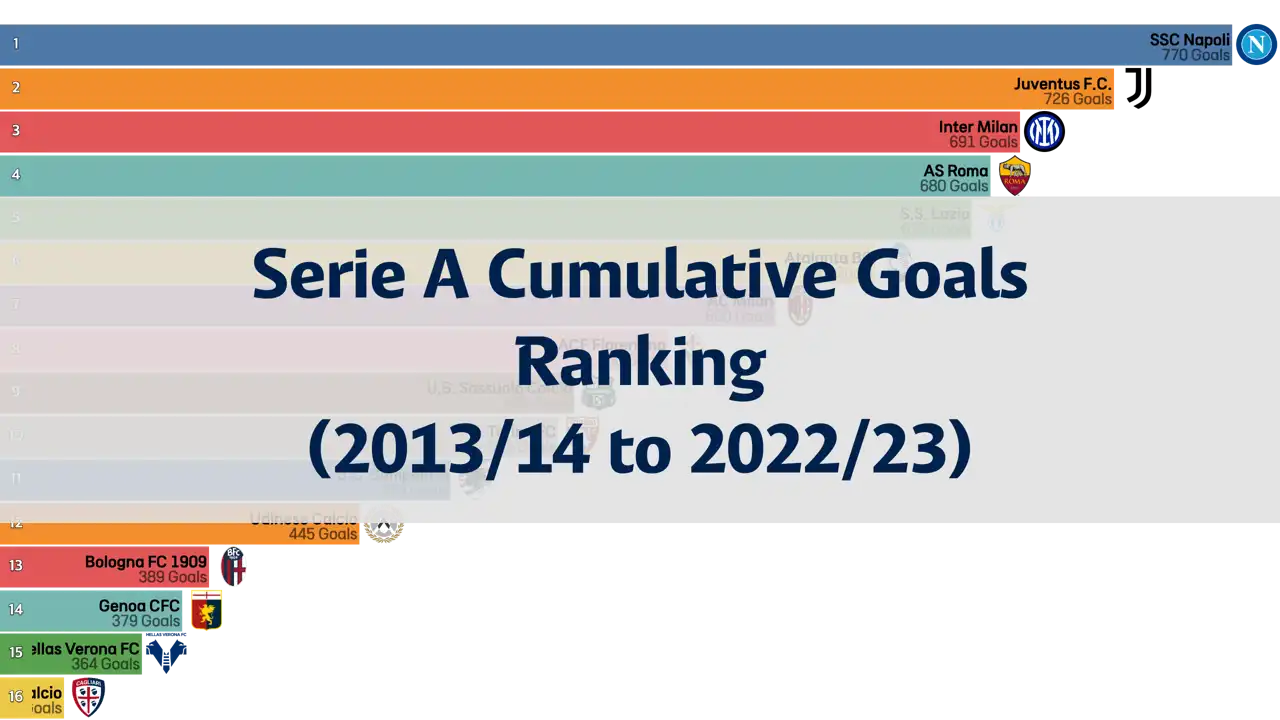
This chart displays the ranking of players with the most goals in Serie A from the 2013/14 season to the 2022/23 season. This period serves as an important indicator of each player's scoring ability and consistency, with a high number of goals signifying superior offensive performance in Italy's top football league. The chart provides insight into the top scorers in Serie A history and their goal-scoring trends over this time.
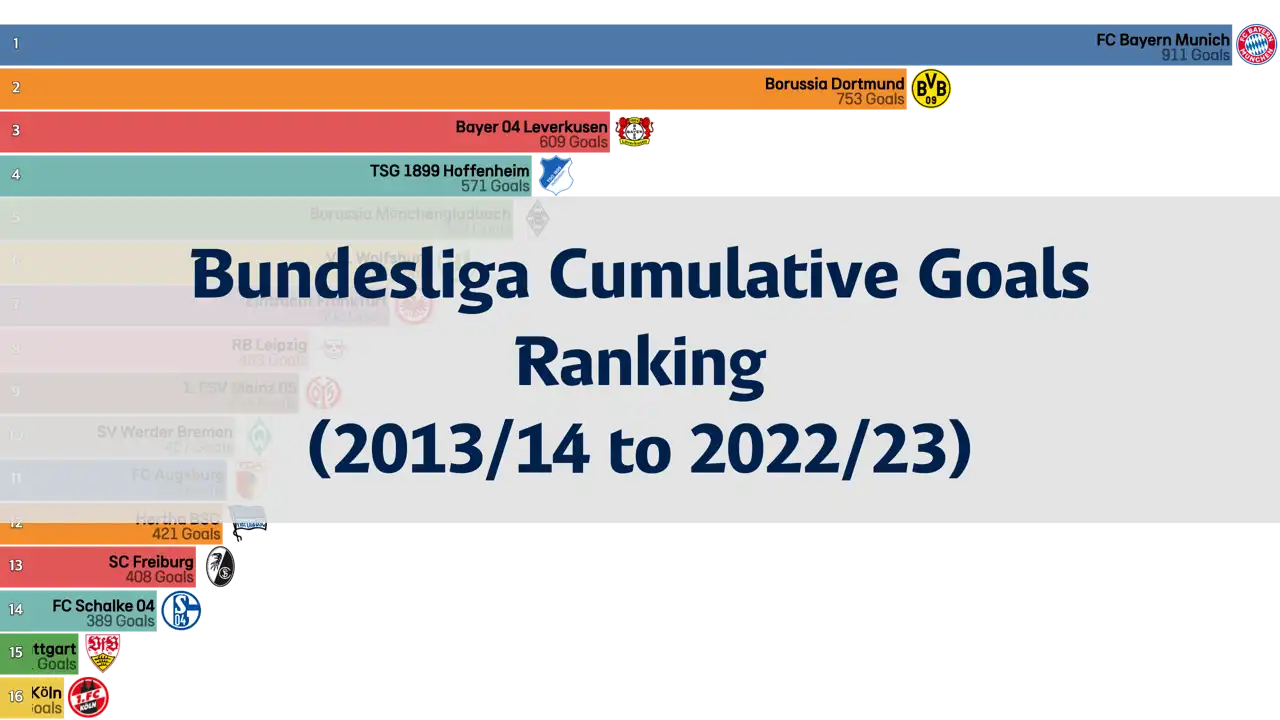
This chart presents the ranking of players with the most goals in the Bundesliga from the 2013/14 season to the 2022/23 season. It serves as a crucial indicator of each player's scoring ability and consistency over this period, with a high number of goals indicating outstanding offensive performance in one of the world's most competitive football leagues. The chart allows us to observe the top scorers in Bundesliga history and their goal-scoring trends over time.
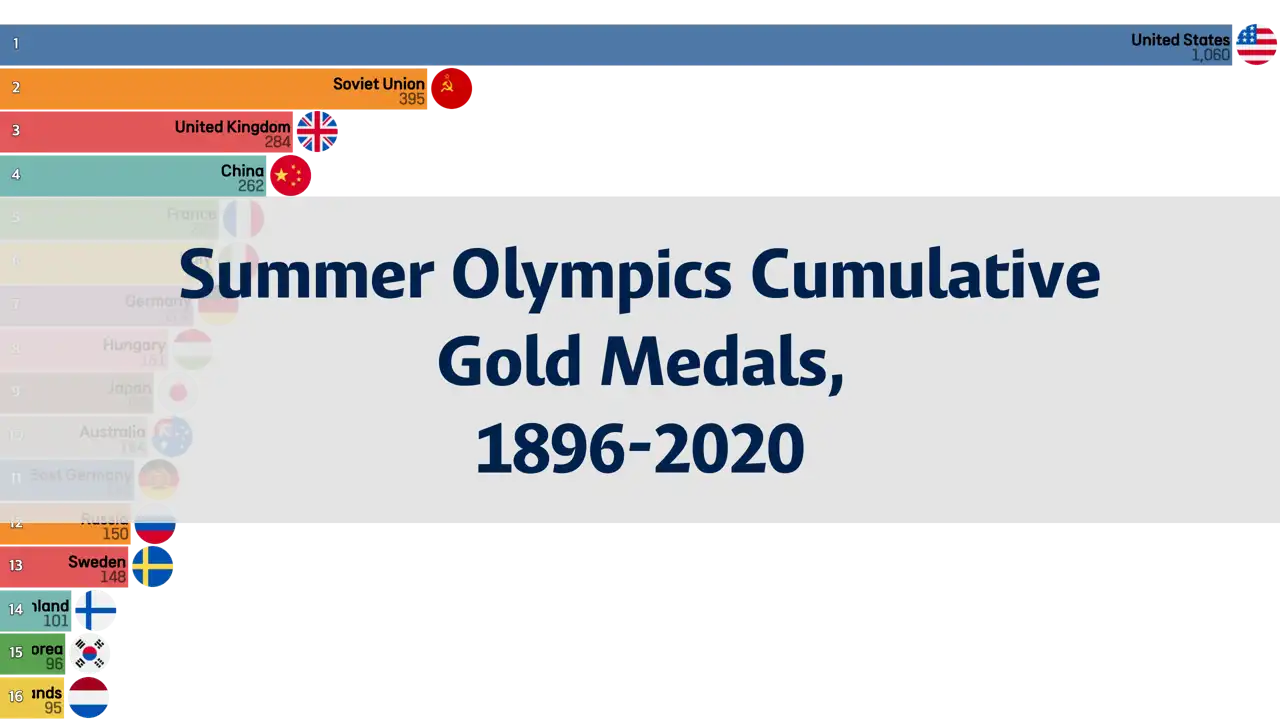
This chart shows the cumulative number of gold medals won by countries in the Summer Olympics from 1896 to 2020. This period serves as an important indicator of each country's sports performance and excellence in the Summer Olympics, reflecting the level of sports development and position in international sports competition. Through this chart, we can observe the trends of countries that have historically been sports powerhouses and those that have seen significant changes in their gold medal counts over time.