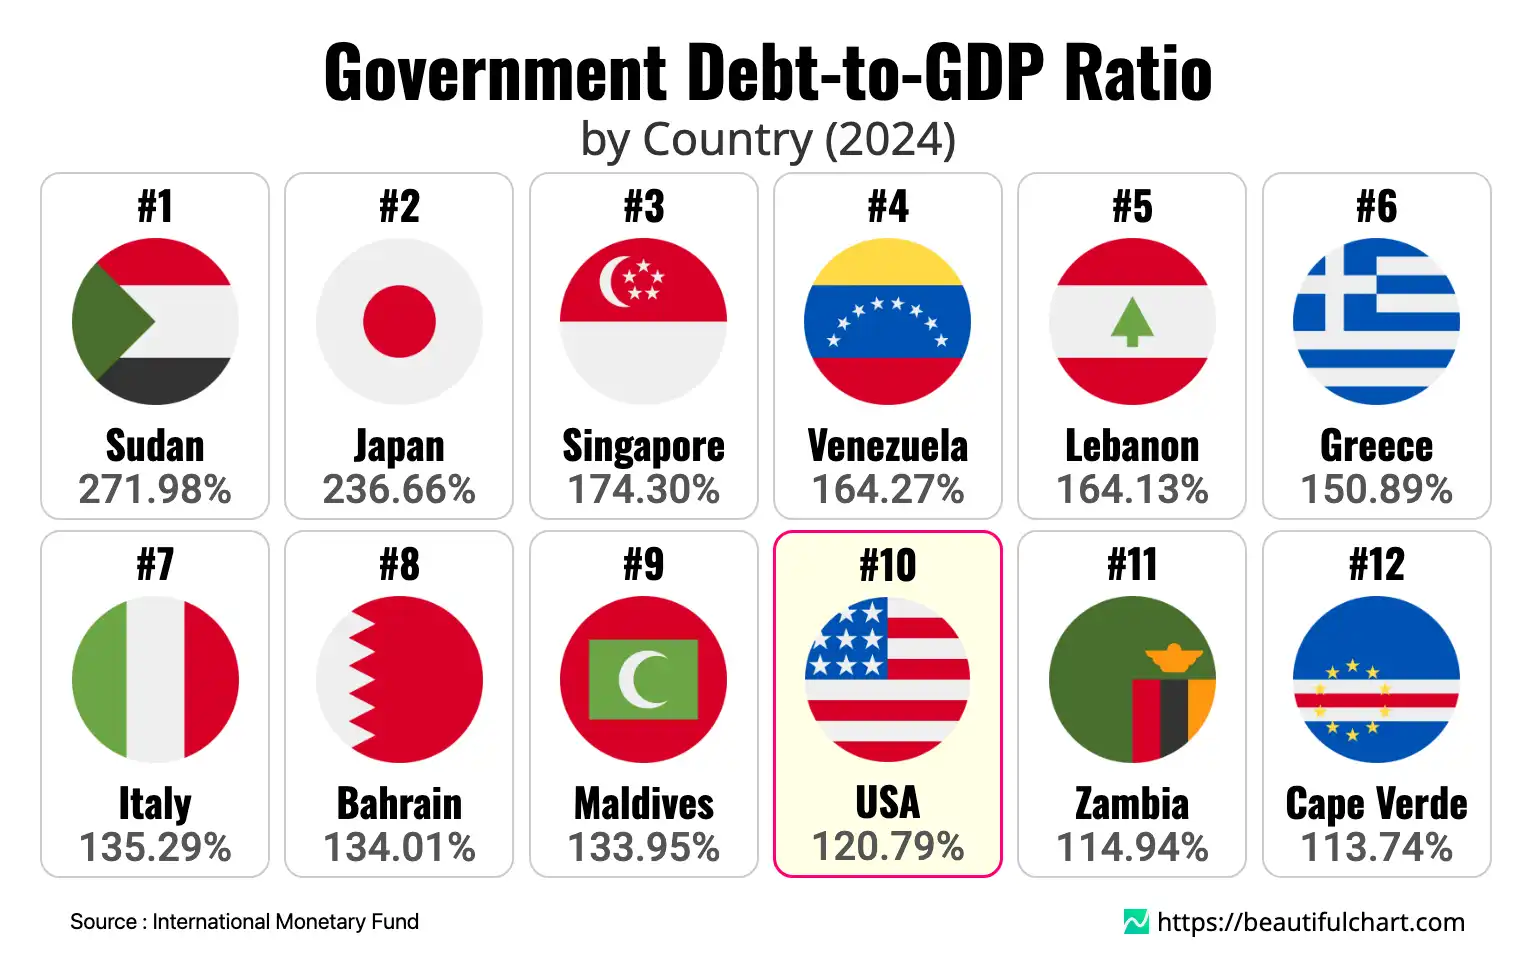
The 2024 data reveals a wide disparity in government debt-to-GDP ratios across the globe. Sudan and Japan exhibit the highest levels, with debt exceeding their economic output by more than double at 271.98% and 236.66%, respectively. In contrast, countries like Brunei and Kuwait maintain very low ratios. The United States, a major global economy, registers a significant debt-to-GDP ratio of 120.79%, placing it among the top 10 most indebted nations.
The government debt-to-GDP ratio is a key economic indicator that compares a country's total government debt to its Gross Domestic Product (GDP). It represents the country's ability to pay back its debts without needing to raise additional funds. A high ratio can indicate potential financial difficulties, while a low ratio suggests a more stable and healthy economy.
The relationship between a country's government debt and its Gross Domestic Product (GDP) is a critical indicator of its financial health and economic stability. This ratio provides insight into a nation's ability to service its debts without resorting to further borrowing. A high ratio often signals potential economic vulnerabilities, while a lower ratio can indicate a more resilient and sustainable fiscal position.
Factors Driving High National Debt
Several factors contribute to the accumulation of significant government debt. Persistent budget deficits, where government spending exceeds revenues, are a primary driver. This can be exacerbated by economic downturns, which reduce tax receipts while increasing demand for social support programs like unemployment benefits. Furthermore, significant government investments in infrastructure, defense, or social welfare, while potentially beneficial in the long term, often require substantial upfront borrowing. In some cases, countries accumulate debt due to financial crises, the bailout of critical industries, or prolonged periods of conflict and instability, as seen in nations like Sudan and Lebanon.
The Economic Landscape of Major Economies
Even the world's largest economies are not immune to high debt levels. The United States, for instance, has a debt-to-GDP ratio of 120.79%. This is driven by decades of deficit spending, significant military expenditures, and the costs of social programs like Social Security and Medicare. Similarly, Japan's ratio of 236.66% is the result of decades of economic stagnation and stimulus spending aimed at reviving its economy. For these economic powerhouses, the ability to borrow in their own currencies and the high global demand for their government bonds provide a degree of stability, but the long-term sustainability of such high debt levels remains a subject of intense debate among economists.
Implications and Global Trends
The consequences of a high debt-to-GDP ratio can be severe. It can lead to higher borrowing costs, as investors demand greater returns to compensate for increased risk. This, in turn, can divert government spending away from essential services and public investments. In extreme cases, it can lead to a debt crisis, where a country is unable to meet its debt obligations, resulting in severe economic and social turmoil. The data indicates a broad divergence in fiscal discipline and economic circumstances around the world. While some nations, particularly those rich in natural resources like Kuwait and Brunei, enjoy very low debt levels, many others face a challenging path toward fiscal sustainability. The ongoing management of public debt will remain a central challenge for policymakers globally as they navigate an uncertain economic future.
Government Debt to GDP Ratio by Country 2024
The 2024 data reveals a wide disparity in government debt-to-GDP ratios across the globe.
Key Takeaways
High-Debt Nations and Economic Vulnerability
- Sudan and Japan have the highest debt-to-GDP ratios, indicating severe economic stress.
- Countries with high debt may face increased borrowing costs and reduced fiscal flexibility.
- Political instability and economic shocks are common contributors to soaring national debt.
Economic Powers and Debt Management
- Major economies like the United States and Japan also carry substantial debt loads relative to their GDP.
- The U.S. debt ratio of 120.79% reflects ongoing deficit spending and large-scale government programs.
- Despite high debt, the status of these nations in the global financial system allows them to manage their debt burdens differently than smaller economies.
Top Ranking
#1 Sudan 271.98%
Sudan's staggering debt-to-GDP ratio of 271.98% places it at the top of the list, reflecting deep-seated economic and political challenges. Decades of internal conflict, international sanctions, and the loss of oil revenue following the secession of South Sudan have crippled its economy. The government has been unable to generate sufficient revenue to cover its expenses, leading to a heavy reliance on borrowing. This unsustainable debt level creates a vicious cycle, making it nearly impossible to secure favorable lending terms and hindering investment in critical infrastructure and social services, further entrenching the nation in poverty and instability.
#2 Japan 236.66%
Japan's position as the second-most indebted nation, with a ratio of 236.66%, is a unique case among developed economies. This situation is the result of a multi-decade battle against deflation and economic stagnation. The government has implemented numerous large-scale fiscal stimulus packages to spur growth, financed primarily through the issuance of government bonds. A key factor that allows Japan to sustain this debt is that the vast majority of it is held domestically, by the Bank of Japan and local investors. This insulates the country from the whims of foreign creditors but raises long-term questions about fiscal sustainability and the eventual path to normalization.
#3 Singapore 174.30%
Singapore's high debt-to-GDP ratio of 174.30% can be misleading if not properly understood. Unlike countries that borrow to finance budget deficits, Singapore's government is constitutionally required to maintain a balanced budget. The country issues bonds primarily to create a safe investment vehicle for its citizens' mandatory retirement savings (the Central Provident Fund) and to develop a domestic bond market. The funds raised are not used for government spending but are invested, and the returns from these investments are more than sufficient to cover the interest payments on the debt. Therefore, Singapore's debt is not a sign of fiscal weakness but a feature of its unique and robust financial architecture.
#4 Venezuela 164.27%
Venezuela's debt-to-GDP ratio of 164.27% is a direct consequence of a catastrophic economic collapse. The nation, which sits on the world's largest oil reserves, has suffered from years of economic mismanagement, hyperinflation, and a dramatic decline in oil production and prices. The government has defaulted on much of its external debt, and the official figures likely understate the true extent of its financial obligations. The economy has shrunk dramatically, which inflates the debt-to-GDP ratio even without new borrowing. The situation reflects a profound and multifaceted crisis that has crippled the country's ability to function and meet its financial commitments.
#5 Lebanon 164.13%
Lebanon's debt-to-GDP ratio of 164.13% is the result of a severe and prolonged financial crisis. For decades, the country operated a state-sponsored Ponzi scheme, attracting foreign currency deposits with high interest rates to finance its massive budget and trade deficits. This system collapsed in 2019, leading to a sovereign default, a banking sector meltdown, and hyperinflation. The political and economic paralysis has prevented any meaningful reforms, leaving the country in a state of financial ruin. The high debt level is a symptom of a deeply broken economic model and a political class unable to enact the necessary changes for recovery.
#10 USA 120.79%
The United States holds a debt-to-GDP ratio of 120.79%, placing it among the most indebted major economies. This substantial figure is the result of decades of bipartisan fiscal policy choices, including significant tax cuts and increased spending on defense, healthcare (Medicare/Medicaid), and social security. The global financial crisis of 2008 and the COVID-19 pandemic also led to massive government stimulus packages that added trillions to the national debt. As the issuer of the world's primary reserve currency, the U.S. has been able to borrow at low interest rates, but the long-term trajectory of its debt poses significant challenges for future economic policy and intergenerational equity.
| Rank | Name | Indicator | Subindicator |
|---|---|---|---|
1 | 271.98% | GDP : $ 28B 270M | |
2 | 236.66% | GDP : $ 4T 26B | |
3 | 174.30% | GDP : $ 547B | |
4 | 164.27% | GDP : $ 119B | |
5 | 164.13% | GDP : $ 28B 280M | |
6 | 150.89% | GDP : $ 257B | |
7 | 135.29% | GDP : $ 2T 372B | |
8 | 134.01% | GDP : $ 46B 943M | |
9 | 133.95% | GDP : $ 7B 19M | |
10 | 120.79% | GDP : $ 29T 184B | |
11 | 114.94% | GDP : $ 26B 326M | |
12 | 113.74% | GDP : $ 2B 726M | |
13 | 113.67% | GDP : $ 32B 892M | |
14 | 113.11% | GDP : $ 3T 162B | |
15 | 110.77% | GDP : $ 2T 241B | |
16 | 107.78% | GDP : $ 3B 92M | |
17 | 104.47% | GDP : $ 664B | |
18 | 102.92% | GDP : $ 7B 167M | |
19 | 101.82% | GDP : $ 1T 722B | |
20 | 101.23% | GDP : $ 3T 644B |


