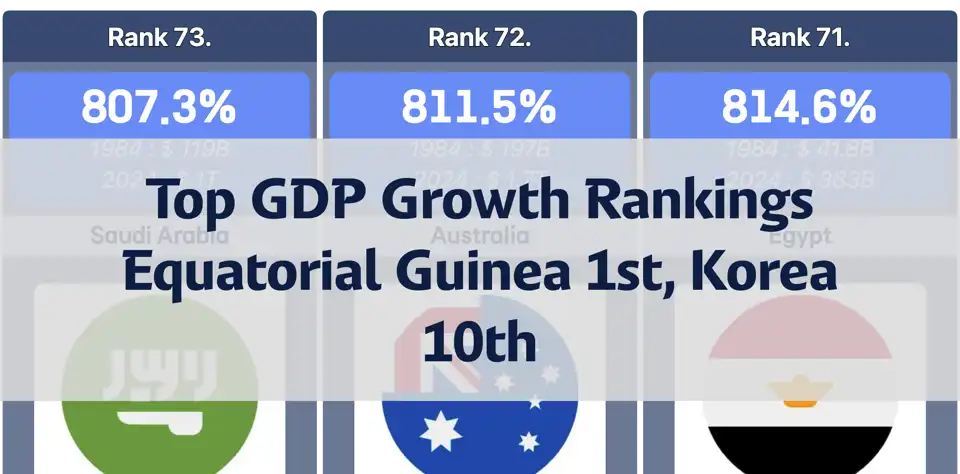
EconomyTop GDP Growth Rate Rankings from 1984 to 2024: South Korea Ranks 10th, Equatorial Guinea Takes the LeadBetween 1984 and 2024, Equatorial Guinea recorded the highest GDP growth rate among all countries, with an astonishing 28,409%.Jun 10, 2025
National RankingsEconomyGlobal Ranking of Government Debt-to-GDP Ratios: Sudan, Japan, and Singapore Lead in 2024This chart illustrates the ratio of government debt to GDP for various countries in 2024.May 22, 2025
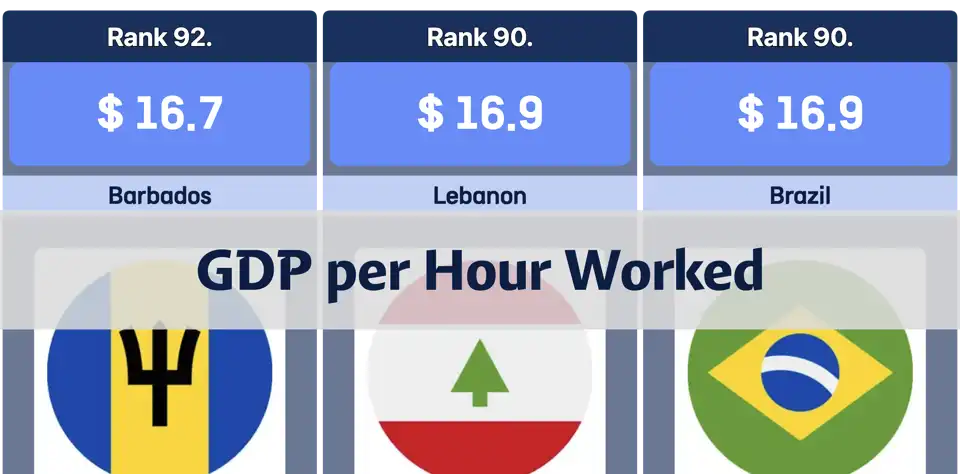
National RankingsEconomyGDP per Hour Worked by CountryThis chart ranks countries by GDP per hour worked, highlighting economic productivity per labor hour across nations.Nov 7, 2024
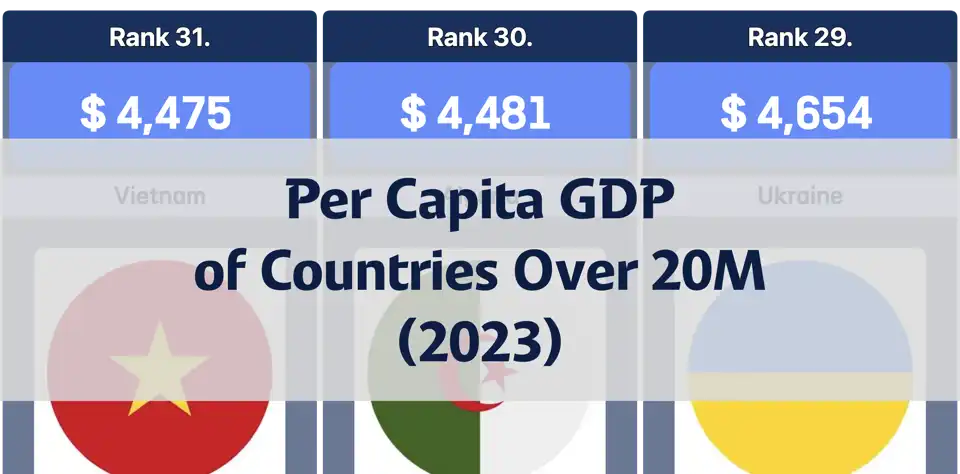
EconomyPer Capita GDP of Countries with a Population Over 20 Million, 2023This chart compares the per capita GDP of countries with a population over 20 million as of 2023.Sep 13, 2024
National RankingsEconomyComparison of GDP between the US and Rival Countries, 1992-2024 (Rival countries include Russia, China, India, and the European Union)This chart compares the GDP of the US and its major rival countries (Russia, China, India, and the European Union) from 1992 to 2024.Jun 29, 2024
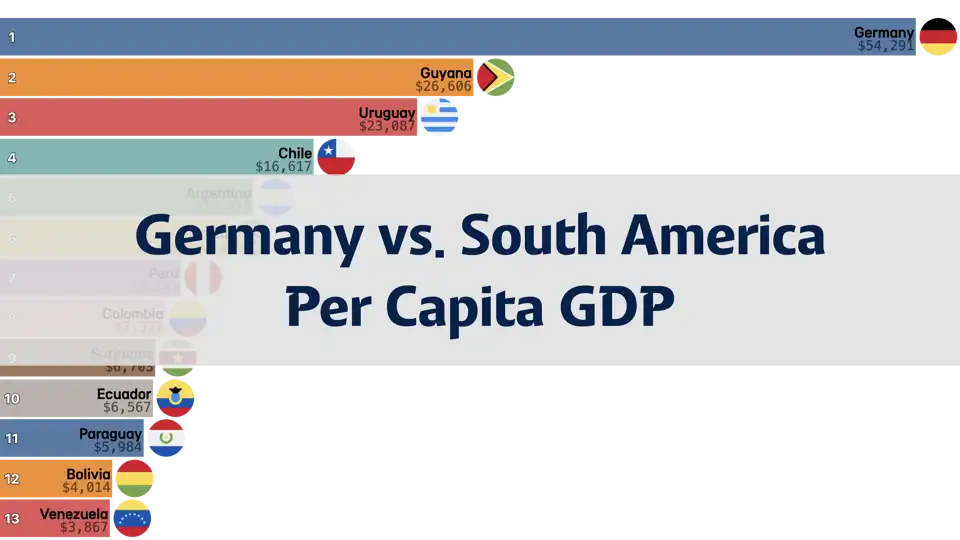
National RankingsEconomyComparison of Per Capita GDP in Germany and South America, 1980-2024This chart compares the per capita GDP of Germany and major South American countries from 1980 to 2024.Jun 29, 2024
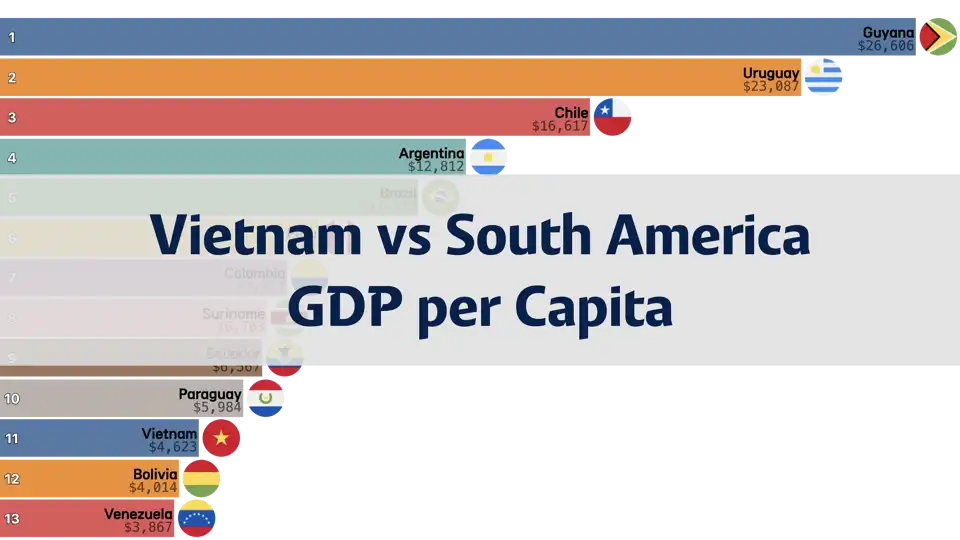
National RankingsEconomyComparison of Vietnam and South America’s GDP per Capita, 1980-2024This chart compares the GDP per capita of Vietnam and South American countries from 1980 to 2024.Jun 29, 2024
National RankingsEconomyComparison of Taiwan and South America’s GDP per Capita, 1980-2024This chart compares the GDP per capita of Taiwan and South American countries from 1980 to 2024.Jun 29, 2024
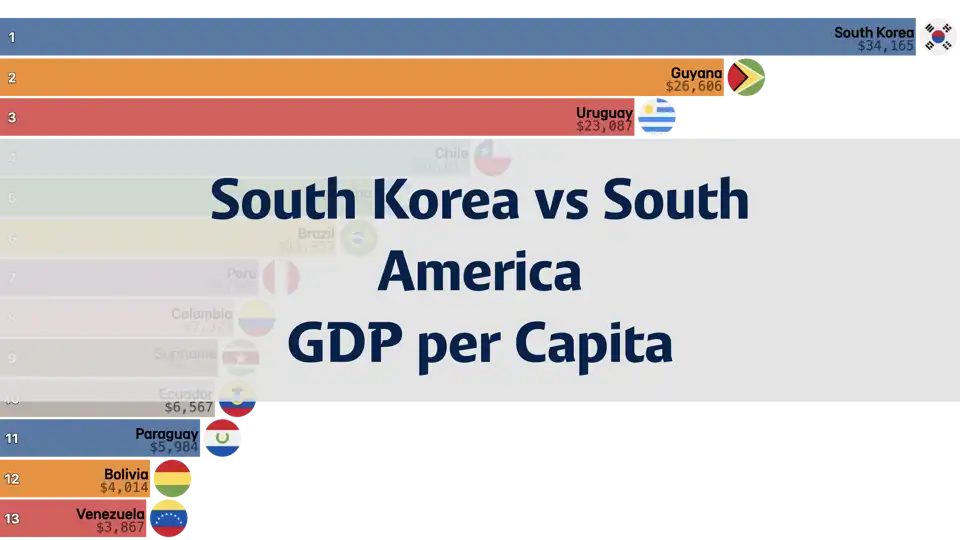
National RankingsEconomyComparison of South Korea and South America’s GDP per Capita, 1980-2024This chart compares the GDP per capita of South Korea and South American countries from 1980 to 2024.Jun 29, 2024
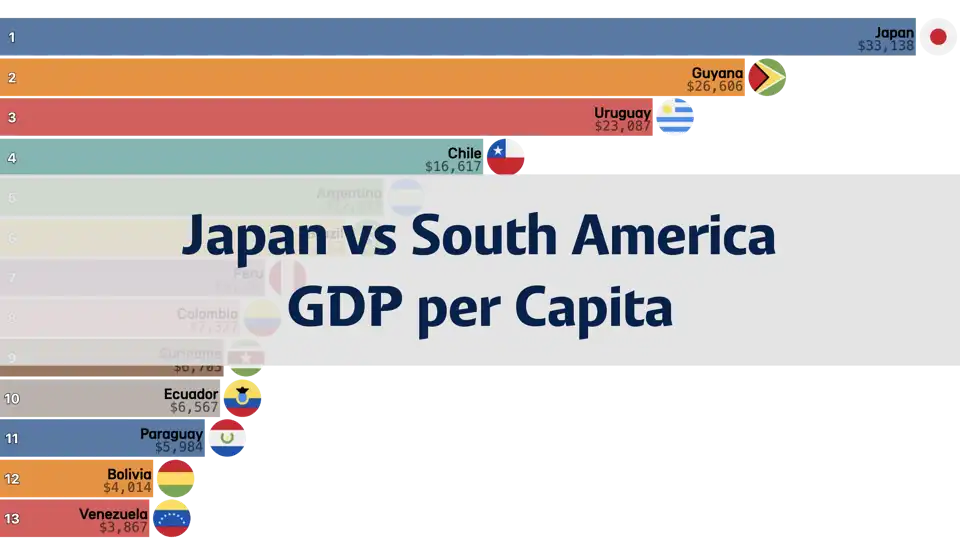
National RankingsEconomyComparison of Japan and South America’s GDP per Capita, 1980-2024This chart compares the GDP per capita of Japan and South American countries from 1980 to 2024.Jun 29, 2024
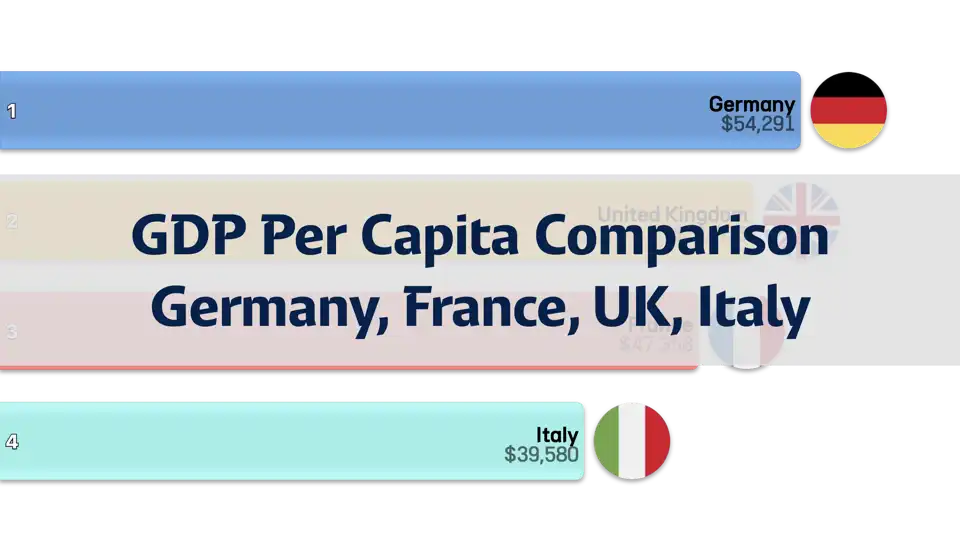
National RankingsEconomyComparison of GDP Per Capita in Germany, France, the United Kingdom, and Italy, 1980-2024This chart compares the GDP per capita of Germany, France, the United Kingdom, and Italy from 1980 to 2024.Jun 27, 2024
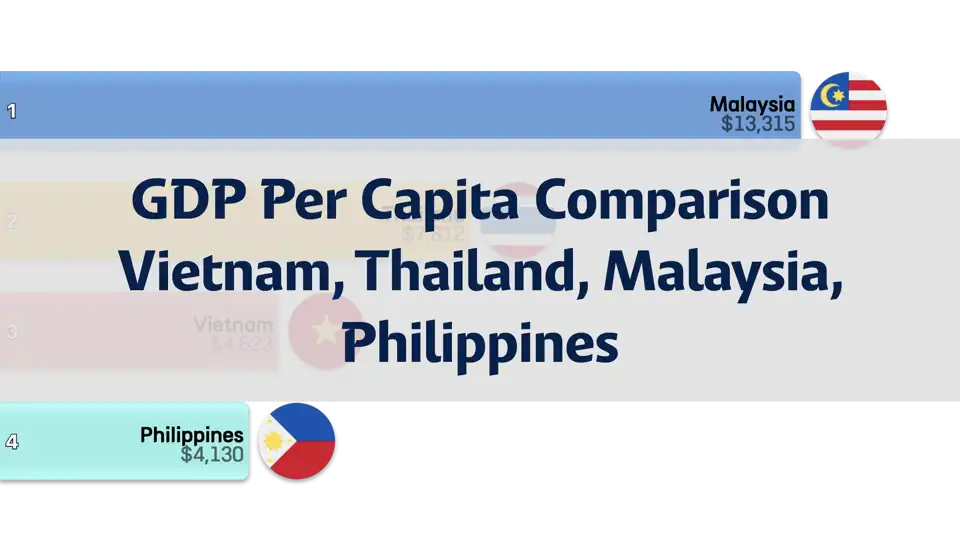
National RankingsEconomyComparison of GDP Per Capita in Vietnam, Thailand, Malaysia, and the Philippines, 1980-2024This chart compares the GDP per capita of Vietnam, Thailand, Malaysia, and the Philippines from 1980 to 2024.Jun 27, 2024
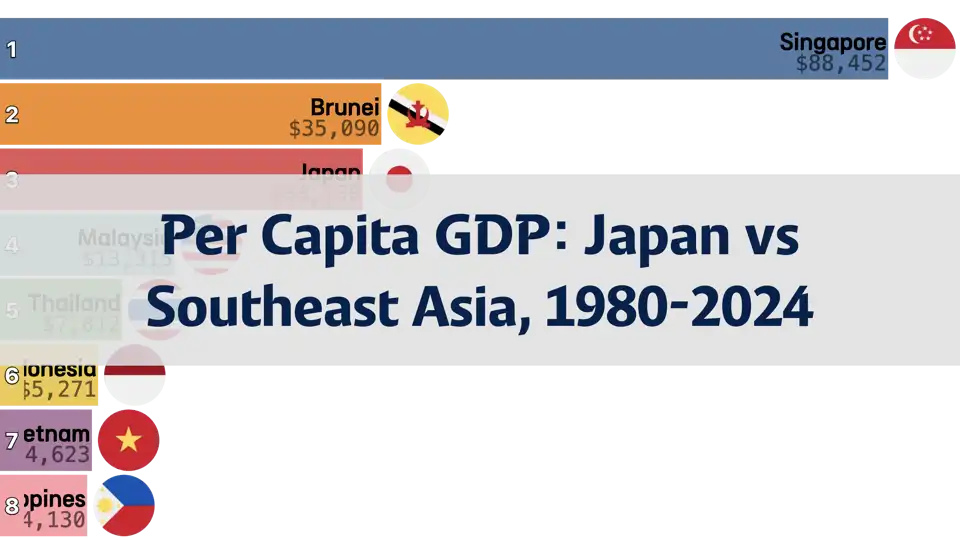
National RankingsEconomyComparison of Per Capita GDP: Japan and Southeast Asia, 1980 to 2024This chart compares the per capita GDP of Japan and Southeast Asian countries from 1980 to 2024.Jun 27, 2024
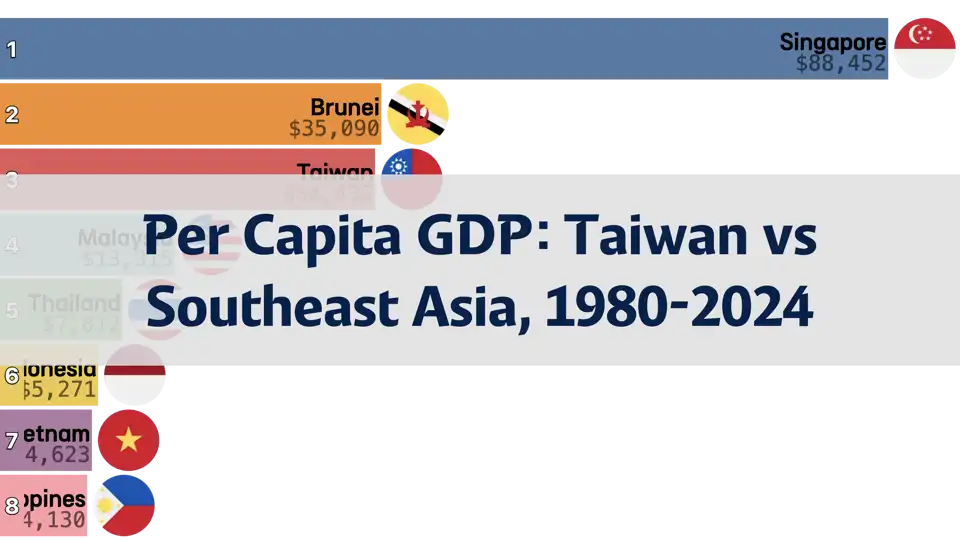
National RankingsEconomyComparison of Per Capita GDP: Taiwan and Southeast Asia, 1980 to 2024This chart compares the per capita GDP of Taiwan and Southeast Asian countries from 1980 to 2024.Jun 27, 2024
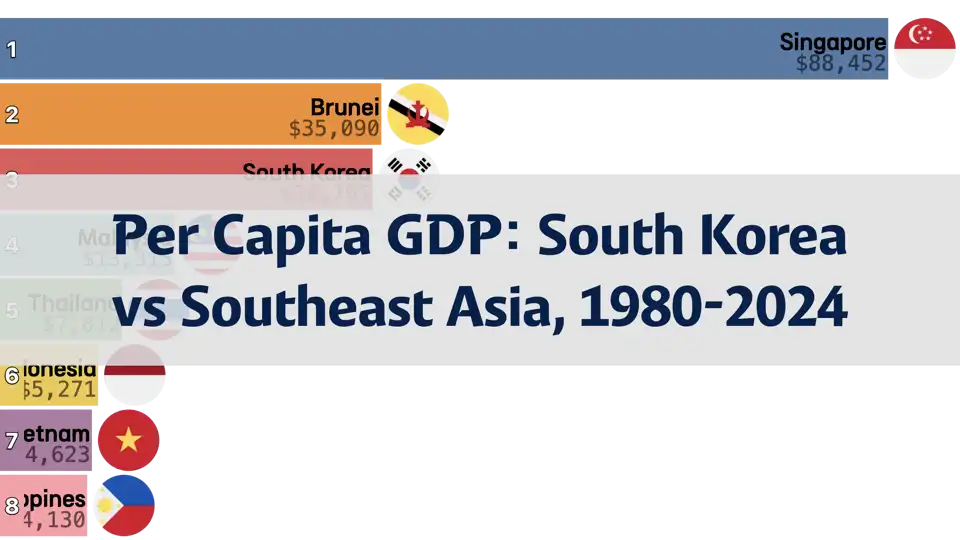
National RankingsEconomyComparison of Per Capita GDP: South Korea and Southeast Asia, 1980 to 2024This chart compares the per capita GDP of South Korea and Southeast Asian countries from 1980 to 2024.Jun 27, 2024
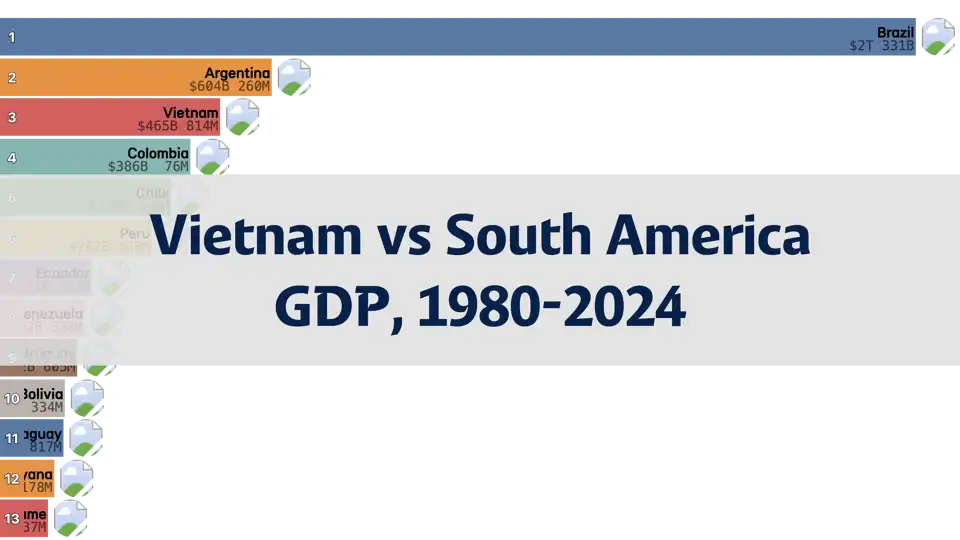
National RankingsEconomyGDP Comparison of Vietnam and South American Countries, 1980-2024This chart compares the GDP of Vietnam and major South American countries from 1980 to 2024.Jun 18, 2024
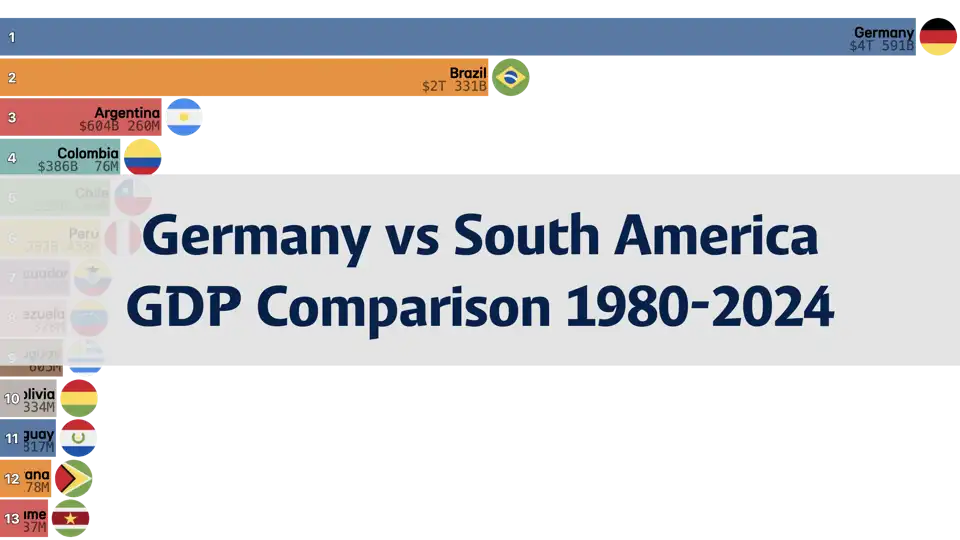
National RankingsComparison of GDP between Germany and South American Countries, 1980 to 2024This chart compares the GDP of Germany and major South American countries from 1980 to 2024.Jun 18, 2024
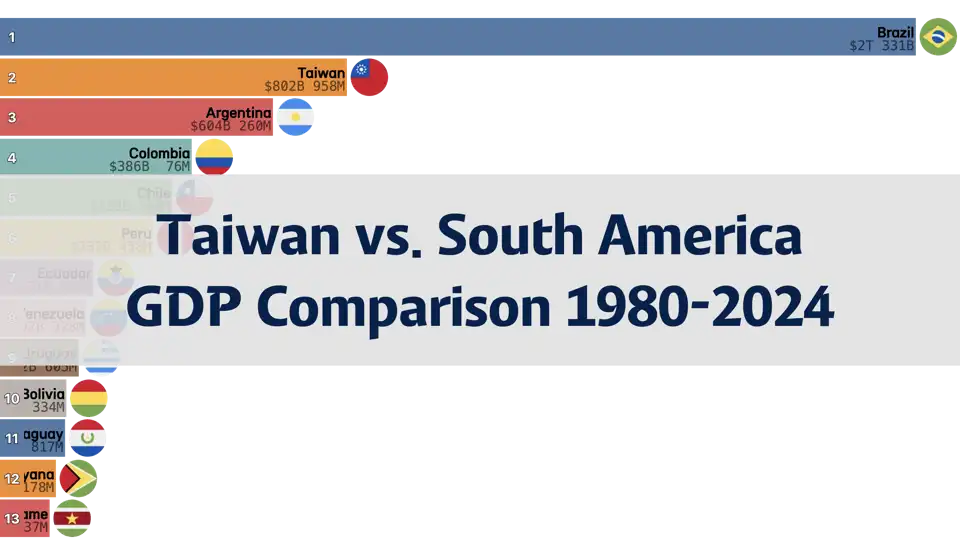
National RankingsEconomyComparison of GDP: Taiwan vs. South American Countries, 1980-2024This chart compares the GDP of Taiwan and South American countries from 1980 to 2024.Jun 18, 2024
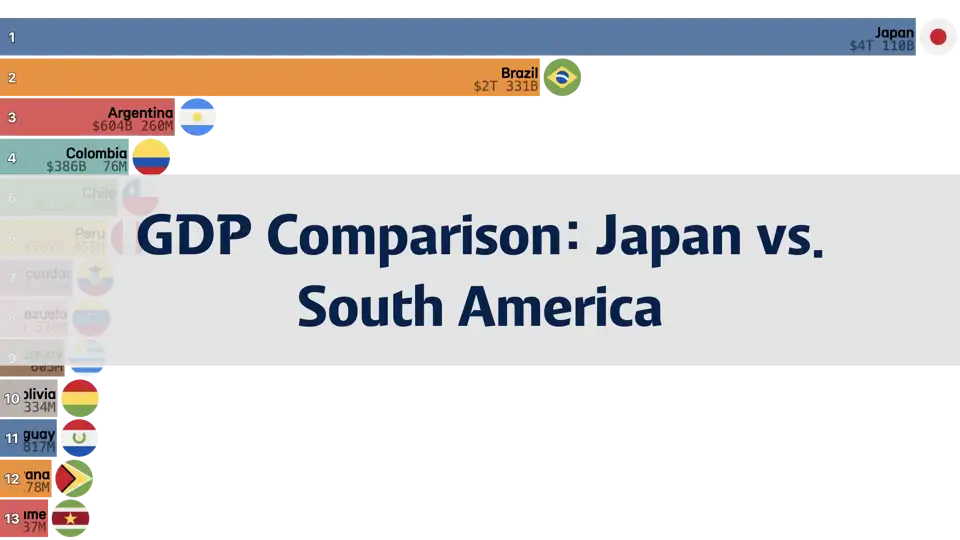
National RankingsEconomyComparison of GDP Between Japan and South American Countries, 1980-2024This chart compares the Gross Domestic Product (GDP) of Japan and major South American countries from 1980 to 2024.Jun 18, 2024
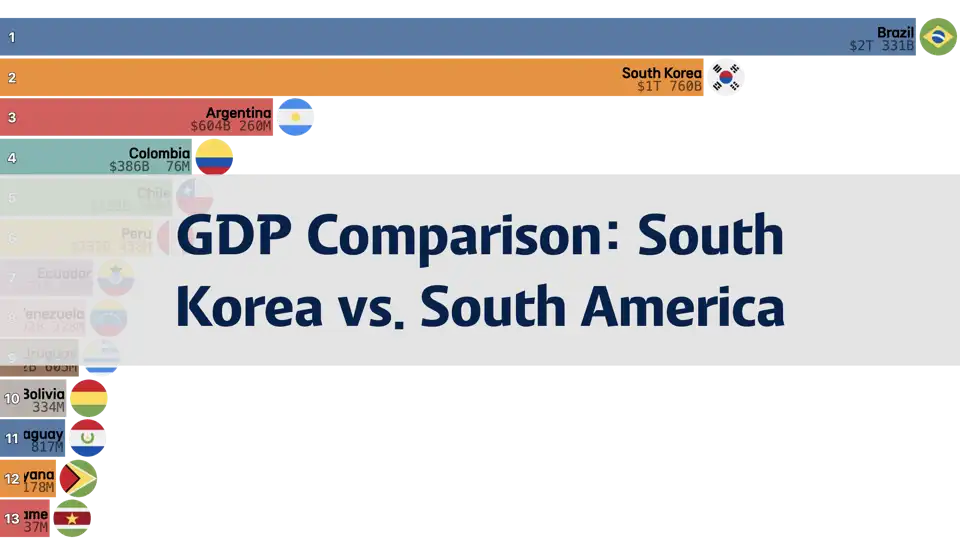
National RankingsEconomyComparison of GDP Between South Korea and South American Countries, 1980-2024This chart compares the Gross Domestic Product (GDP) of South Korea and major South American countries from 1980 to 2024.Jun 18, 2024
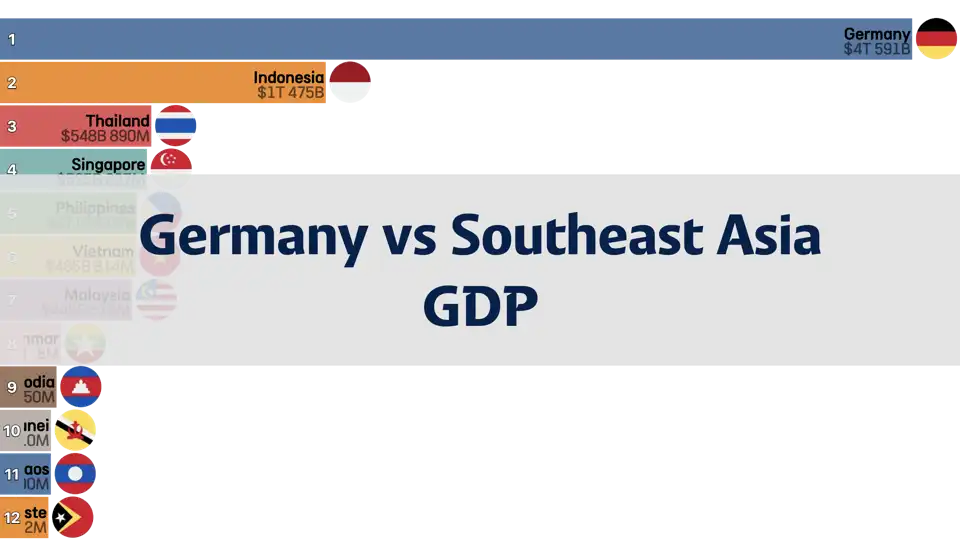
National RankingsEconomyComparison of GDP between Germany and Southeast Asia, 1980 to 2024This chart compares the GDP growth of Germany and key Southeast Asian countries from 1980 to 2024.Jun 11, 2024
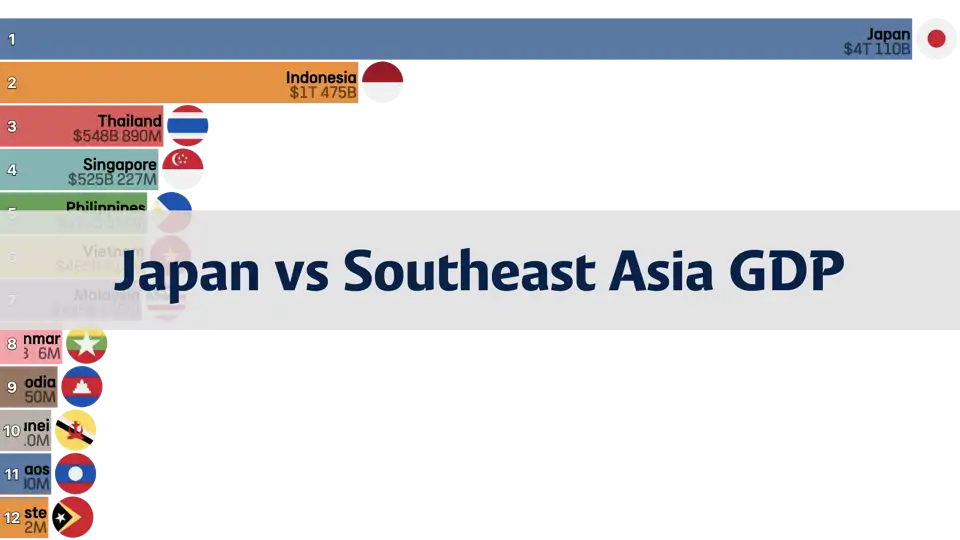
National RankingsEconomyComparison of GDP Between Japan and Southeast Asia, 1980-2024This chart compares the GDP of Japan and Southeast Asian countries from 1980 to 2024.Jun 9, 2024
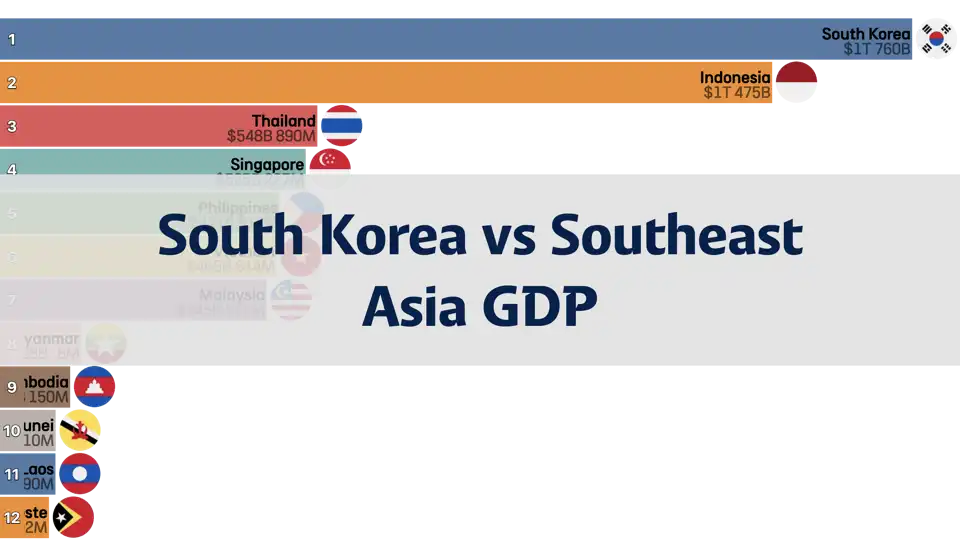
National RankingsEconomyComparison of GDP Between South Korea and Southeast Asia, 1980-2024This chart compares the GDP of South Korea and Southeast Asian countries from 1980 to 2024.Jun 9, 2024
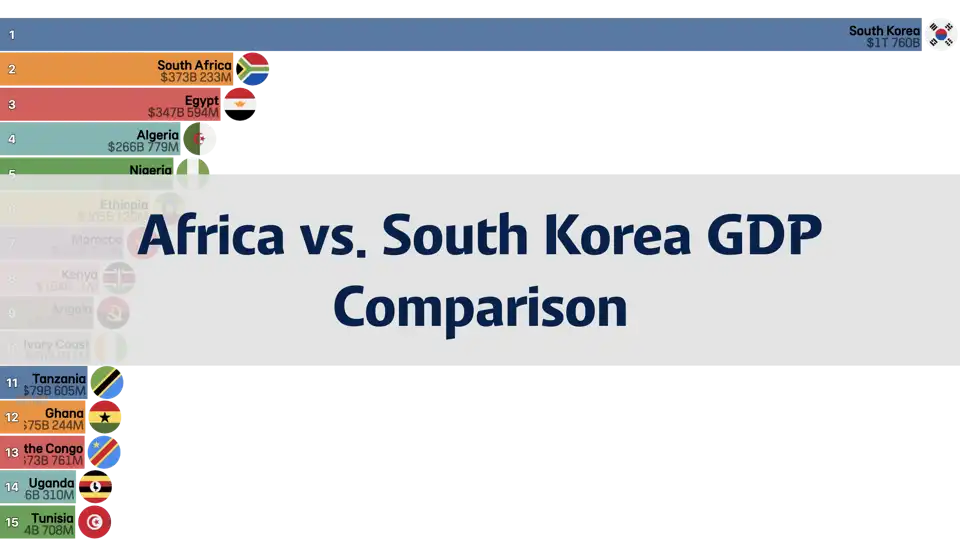
National RankingsEconomyComparison of GDP Between Africa and South Korea, 1980-2024This chart compares the GDP of Africa and South Korea from 1980 to 2024.Jun 7, 2024
National RankingsEconomyComparison of GDP Between Africa and Germany, 1980-2024This chart compares the GDP of Africa and Germany from 1980 to 2024.Jun 7, 2024
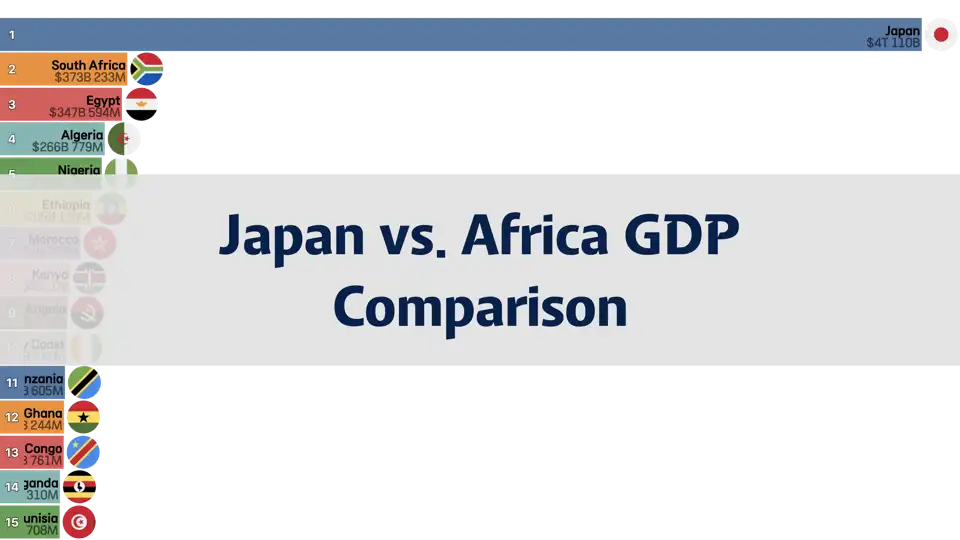
National RankingsEconomyComparison of GDP Between Japan and African Countries, 1980-2024This chart compares the GDP of Japan and African countries from 1980 to 2024.Jun 7, 2024
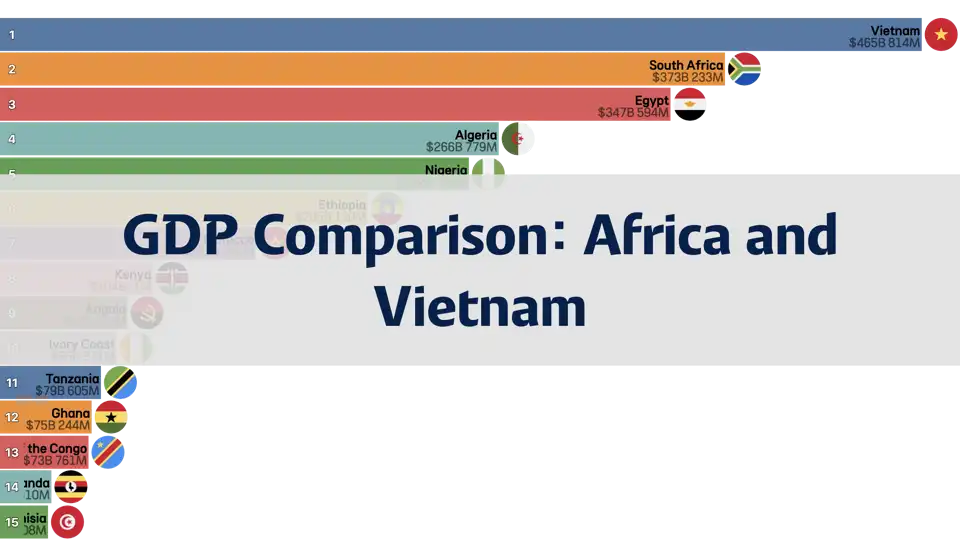
National RankingsEconomyGDP Comparison of Africa and Vietnam, 1980-2024This chart compares the GDP of Africa and Vietnam from 1980 to 2024.Jun 4, 2024
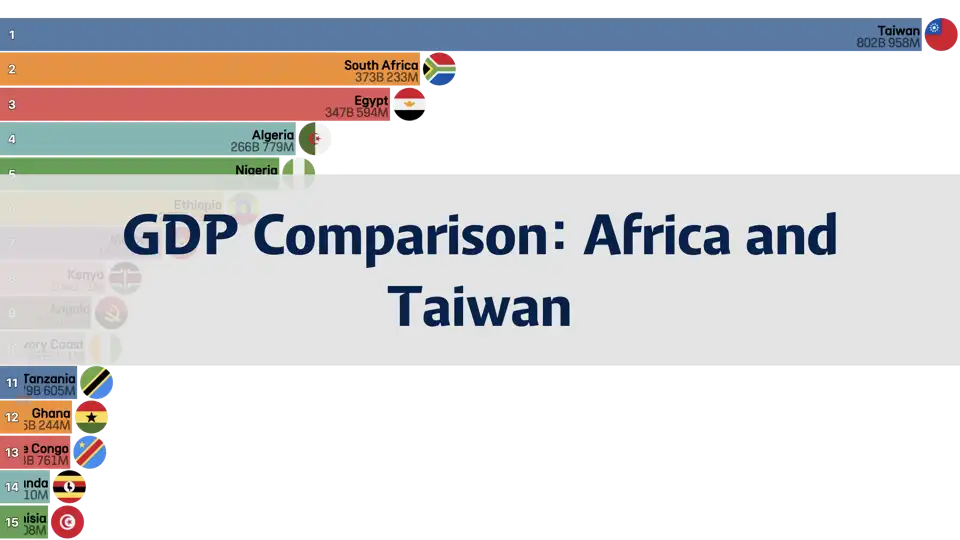
National RankingsEconomyGDP Comparison of Africa and Taiwan, 1980-2024This chart compares the GDP of Africa and Taiwan from 1980 to 2024.Jun 4, 2024
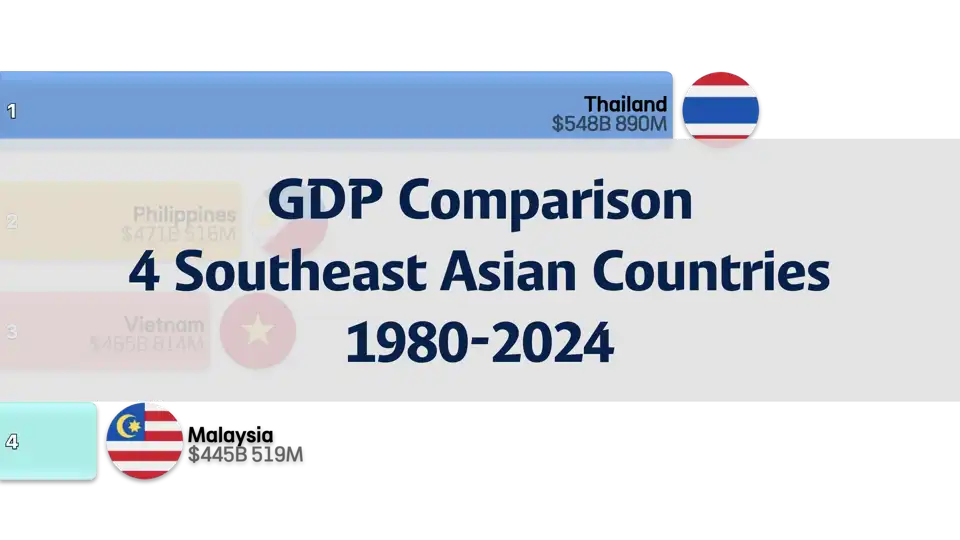
National RankingsEconomyGDP Comparison of 4 Southeast Asian Countries, 1980 to 2024This chart compares the GDP changes of four Southeast Asian countries (Thailand, Malaysia, Indonesia, and the Philippines) from 1980 to 2024.Jun 1, 2024