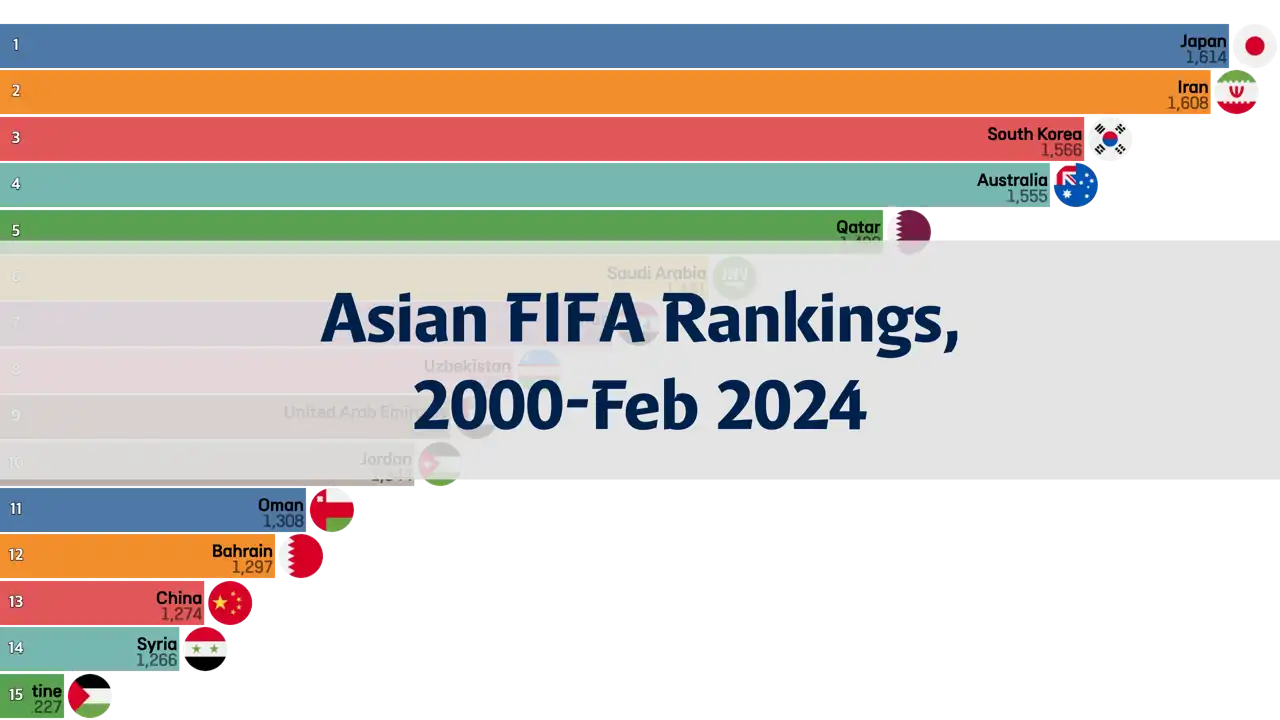
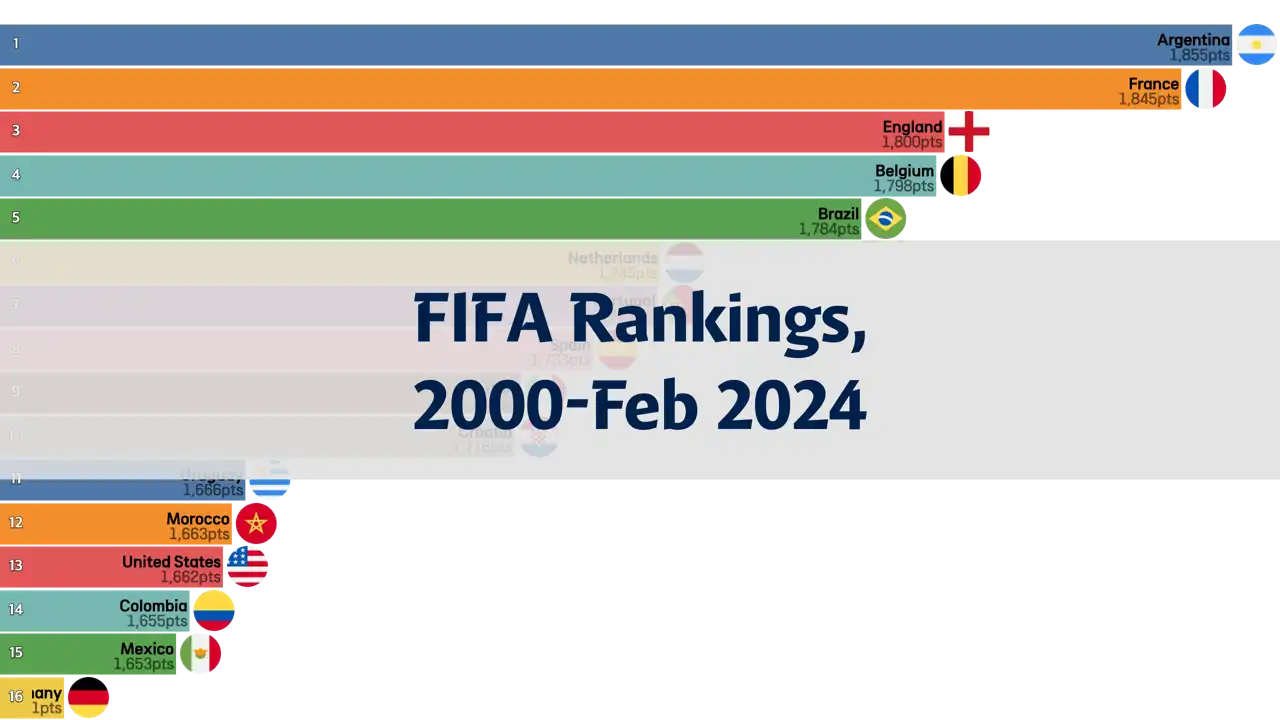
FIFA Rankings from 2000 to February 2024
This chart illustrates the changes in the FIFA rankings from the year 2000 to February 2024. Throughout this period, the ranking fluctuations based on the performance of national football teams offer insights into the competitiveness and trends within world football. The FIFA rankings are determined based on the outcomes of international matches, reflecting the performance of national teams in competitions and friendly matches.
FIFA rankings: A system used by the International Federation of Association Football (FIFA) to rank national football teams based on their game results. These rankings consider various factors, including match outcomes, the importance of the competitions, and the strength of the opposing teams, serving as a key indicator of current global football competitiveness.
01/2000
- Brazil : 839pts
- Czech Republic : 774pts
- France : 765pts
- Spain : 753pts
- Germany : 739pts
- Argentina : 721pts
- Norway : 718pts
- Romania : 715pts
- Croatia : 713pts
- Mexico : 706pts
- United States : 619pts
- Australia : 410pts
02/2010
- Spain : 1,627pts
- Brazil : 1,568pts
- Netherlands : 1,288pts
- Italy : 1,209pts
- Portugal : 1,176pts
- Germany : 1,173pts
- France : 1,117pts
- Argentina : 1,082pts
- England : 1,076pts
- Egypt : 1,069pts
- United States : 963pts
- Australia : 857pts
12/2020
- Belgium : 1,780pts
- France : 1,755pts
- Brazil : 1,743pts
- England : 1,670pts
- Portugal : 1,662pts
- Spain : 1,645pts
- Argentina : 1,642pts
- Uruguay : 1,639pts
- Mexico : 1,632pts
- Italy : 1,625pts
- United States : 1,545pts
- Australia : 1,457pts
02/2024
- Argentina : 1,855pts
- France : 1,845pts
- England : 1,800pts
- Belgium : 1,798pts
- Brazil : 1,784pts
- Netherlands : 1,745pts
- Portugal : 1,745pts
- Spain : 1,733pts
- Italy : 1,719pts
- Croatia : 1,718pts
- United States : 1,662pts
- Australia : 1,555pts
Data Attribution
Image Attribution
"Icon made by Freepik from www.flaticon.com"
전체
National Rankings
Asia & Oceania
Europe
North America
Africa
Southeast Asia
Sports
Soccer
Economy
Society
Population Pyramid
Culture
Movies
Travel
Science & Technology