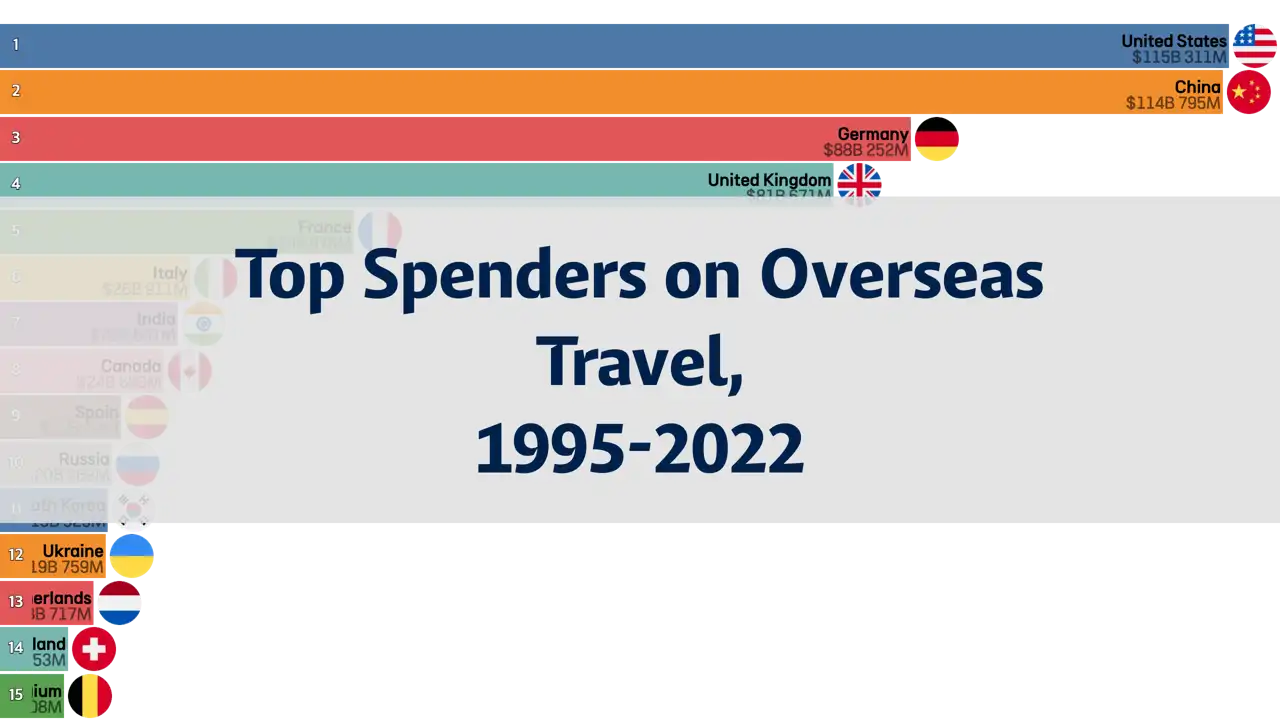
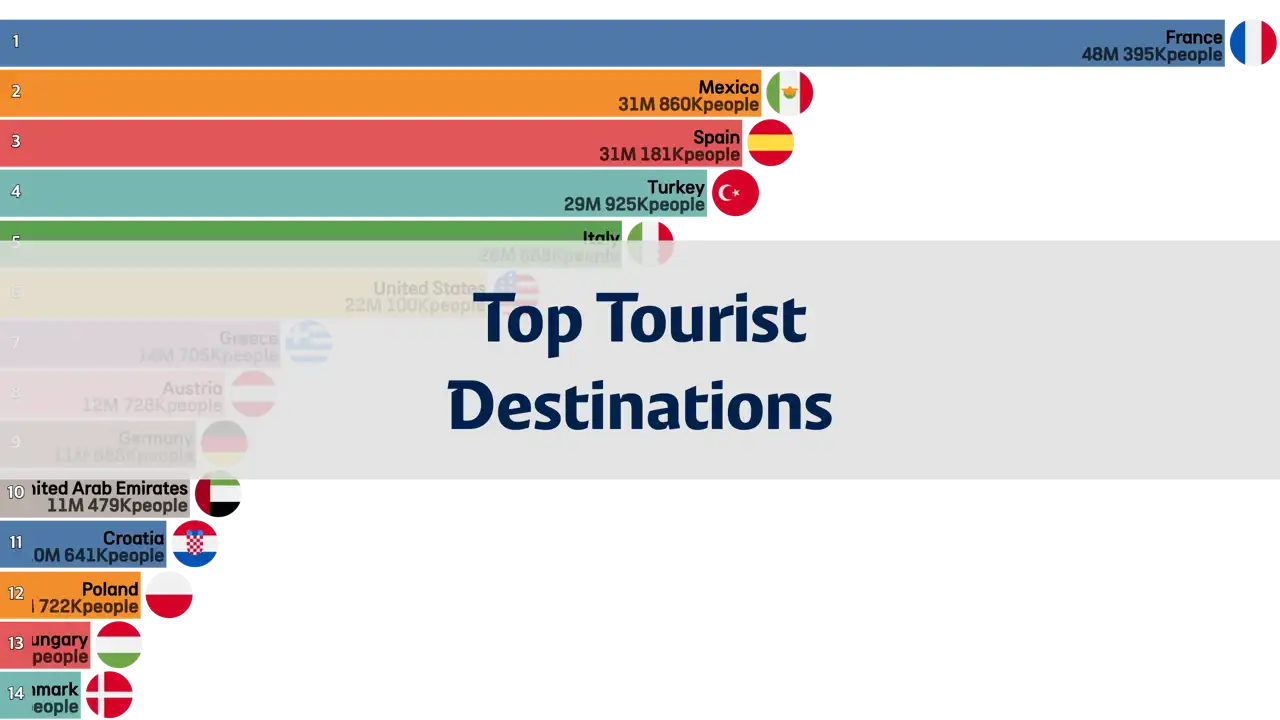
Countries Spending the Most on Overseas Travel, 1995-2022
This chart presents the countries that have spent the most on overseas travel from 1995 to 2022. It highlights the significant shifts and trends in travel economics among key nations over this period. The expenditure on travel reflects the economic conditions, purchasing power of the populace, and shifts in global tourism trends of each country.
Overseas travel expenditure refers to the total amount spent by travelers from a country on accommodations, transport, meals, entertainment, etc., while abroad. It serves as an important indicator of a country's economic strength and its investment in the tourism industry.
Data Attribution
Image Attribution
"Icon made by Freepik from www.flaticon.com"
전체
National Rankings
Asia & Oceania
Europe
North America
Africa
Southeast Asia
Sports
Soccer
Economy
Society
Population Pyramid
Culture
Movies
Travel
Science & Technology