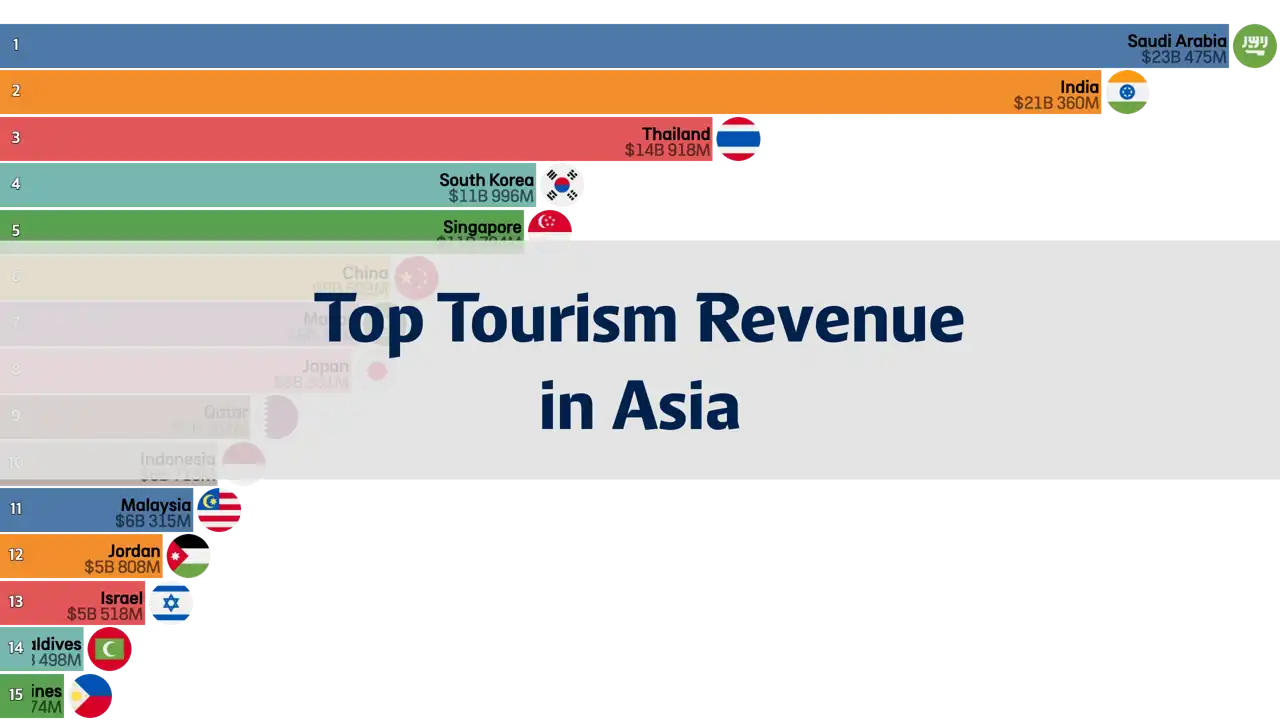
Highest Tourism Revenue in Asia by Country, 1995-2022
This chart illustrates the changes in which Asian country had the highest tourism revenue from 1995 to 2022. Ranking is based on the tourism income, a key indicator of the growth of the tourism industry and its impact on the economy for each year. It reflects the efforts made by various Asian countries to develop their tourism sectors over this period and showcases the contribution of tourism revenue to national economies.
Tourism Revenue: This refers to the economic income a country earns from foreign tourists. It includes earnings from accommodation, food and beverages, entrance fees to tourist attractions, shopping, and other services, playing a crucial role in the economic development and job creation of a country.
1995
- Hong Kong : $9B 604M ($9,604,000,000)
- China : $8B 730M ($8,730,000,000)
- Thailand : $8B 35M ($8,035,000,000)
- Singapore : $7B 611M ($7,611,000,000)
- Indonesia : $5B 229M ($5,229,000,000)
- South Korea : $5B 150M ($5,150,000,000)
- Malaysia : $3B 969M ($3,969,000,000)
- Taiwan : $3B 287M ($3,287,000,000)
- Japan : $3B 224M ($3,224,000,000)
- Israel : $2B 993M ($2,993,000,000)
2010
- China : $45B 814M ($45,814,000,000)
- Macau : $22B 276M ($22,276,000,000)
- Hong Kong : $21B 689M ($21,689,000,000)
- Thailand : $20B 104M ($20,104,000,000)
- Malaysia : $18B 152M ($18,152,000,000)
- India : $14B 490M ($14,490,000,000)
- Singapore : $14B 178M ($14,178,000,000)
- Japan : $13B 224M ($13,224,000,000)
- South Korea : $10B 263M ($10,263,000,000)
- Taiwan : $8B 721M ($8,721,000,000)
2022
- Saudi Arabia : $23B 475M ($23,475,000,000)
- India : $21B 360M ($21,360,000,000)
- Thailand : $14B 918M ($14,918,000,000)
- South Korea : $11B 996M ($11,996,000,000)
- Singapore : $11B 794M ($11,794,000,000)
- China : $9B 583M ($9,583,000,000)
- Macau : $9B 64M ($9,064,000,000)
- Japan : $8B 931M ($8,931,000,000)
- Qatar : $7B 262M ($7,262,000,000)
- Indonesia : $6B 719M ($6,719,000,000)
Data Attribution
Image Attribution
"Icon made by Freepik from www.flaticon.com"
전체
National Rankings
Asia & Oceania
Europe
North America
Africa
Southeast Asia
Sports
Soccer
Economy
Society
Population Pyramid
Culture
Movies
Travel
Science & Technology